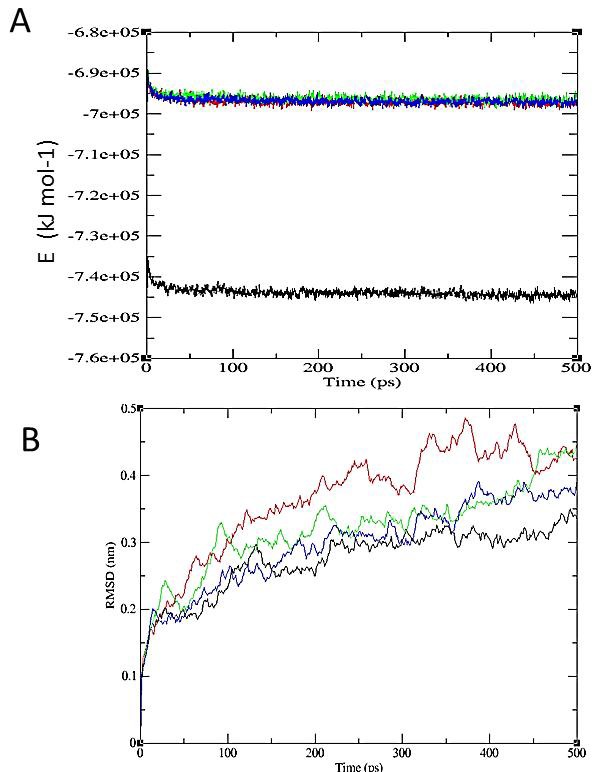
Figure 5.

The stability of p53-mortalin complexes. A. Energy stability of p53-mortalin complex (black line) increase after added the small molecules (blue, red and green line). B. RMSD of p53-mortalin complex (black line) has more unstable after interfered with the small molecules (green, blue and red line). The red color indicates ZINC01019934, green is ZINC00624418, and blue is ZINC00664532.
