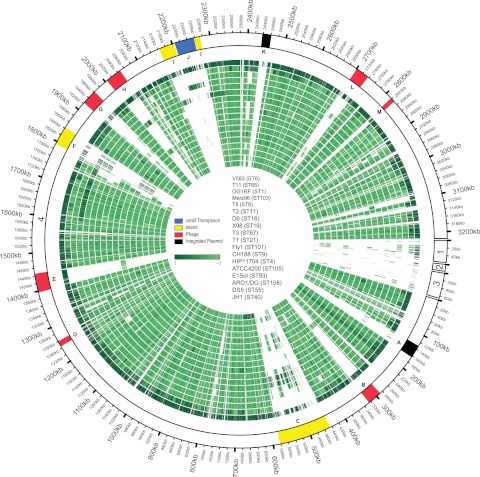
FIG 4 .
E. faecalis genome mosaicism plot. The outermost ring shows E. faecalis V583 chromosomal (scaffold 4) and plasmid scaffolds (scaffold 1, pTEF2; scaffold 2, pTEF3; scaffold 3, pTEF1), with each gene represented as a radial position along the ring. Each of the remaining 17 E. faecalis genomes is represented by the rings below V583. Genes are colored by phylogenetic distance from E. faecalis V583 (from dark to light green with increasing phylogenetic distance), as determined by individual gene trees built from ortholog groups. The strains shown, from the outermost to the innermost rings, are V583, T11, OG1RF, Merz96, T8, T2, D6, X98, T3, T1, Fly1, CH188, HIP11704, ATCC 4200, E1Sol, AR01/DG, DS5, and JH1. The locations of E. faecalis variable regions are shown (9). A, integrated plasmid; B, prophage 1; C, E. faecalis pathogenicity island; D, prophage 2; E, prophage 3; F, putative island; G, prophage 4; H, prophage 5; I, putative island; J, vancomycin resistance (vanB) transposon; K, integrated plasmid; L, prophage 6; M, prophage 7.

