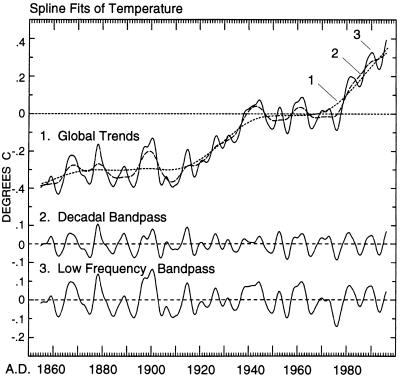
Figure 2.
Spline fits of the global temperature anomaly of Fig. 1 together with associated bandpasses. (Top) Global trends depicted by three superimposed spline fits (15), one consisting of a very stiff spline fit to yearly averages (dotted curve 1, σ of 0.106°C), and two consisting of splines of lesser stiffness fit to monthly averages (dashed curve 2 and solid curve 3, σs of 0.161 and 0.148°C, respectively). (Middle) Decadal bandpass (curve 3 minus curve 2). (Bottom) Low frequency bandpass (curve 3 minus curve 1).

