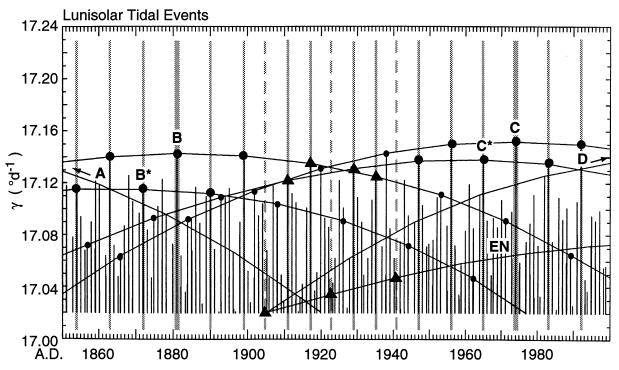
Figure 6.
Timing of prominent lunisolar tide raising forces from A.D. 1850 to 2000 according to Wood (ref. 23, table 16). Each event is plotted as a vertical solid line whose length, above a threshold, is an approximate measure of the strength of forcing, expressed by the quantity γ, in degrees of arc per day, as described in the text. All events with γ greater than 17.02° d−1 are shown, resulting in approximately one displayed event per year. Selected dominant sequences of 18.03-year events, labeled A-D, subdominant sequences, B* and C*, and an equinoctial sequence, EN, are identified by arcs connecting these tidal events and by dots or solid triangles (see text). Vertical hatched lines indicate times of events grouped 6 or 9 years apart, as described in the text.

