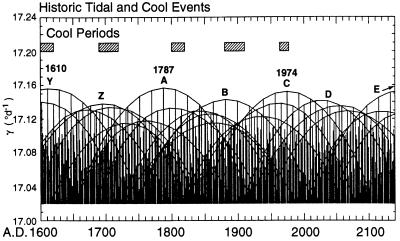
Figure 8.
Timing of tidal forcing from A.D. 1600 to 2140, plotted with arcs connecting events of each prominent 18-year tidal sequence, as in Fig. 6. Also plotted are times of cool episodes seen in climate data identified by Jones and Bradley as of possibly global significance (ref. 44, pp. 658–659). A more recent global cool interval near 1970 is also shown, as discussed in the text. Dominant tidal Sequences A–D are labeled as in Fig. 6. Two earlier Sequences, Y and Z, and a later Sequence E are also labeled. Although climactic events of the dominant sequences from 1700 and 1974 are at 93-year intervals, there are irregularities in the time intervals between earlier and later climactic events, yielding an average near-centenniel interval of about 90 years.

