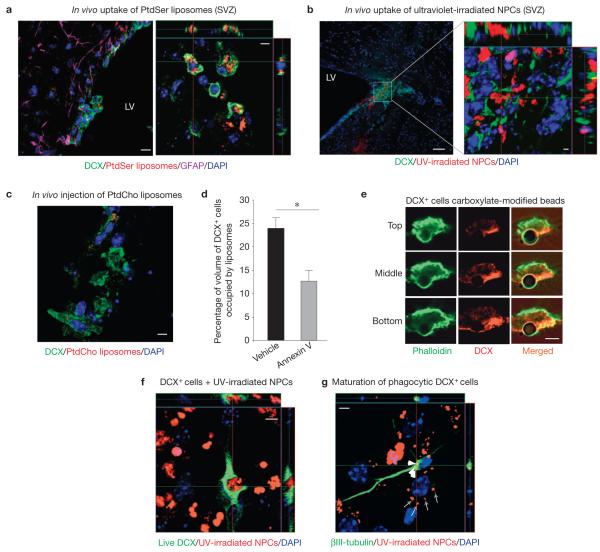
Figure 1.
DCX-expressing neuronal progenitor cells exhibit phagocytic activity in vivo and ex vivo. (a) Wild-type mice (LV, lateral ventricle) intracranially injected with fluorescent PtdSer liposomes examined immunohistochemically in the SVZ for DCX+ and GFAP+ cells with phagocytosed liposomes. DAPI, 4,6-diamidino-2-phenylindole. Representative confocal micrographs are shown (n > 10 fields analysed per experiment; five independent experiments carried out). Scale bar, 10 μm (5 μm in inset). (b) Wild-type mice intracranially injected with fluorescently labelled ultraviolet (UV)-irradiated NPCs examined immunohistochemically in the SVZ for DCX+ cells with phagocytosed cells. A representative micrograph is shown in orthogonal projections of confocal z stacks (n > 12 fields analysed per experiment; three independent experiments carried out). Scale bar, 50 μm (2 μm in inset). (c) Wild-type mice intracranially injected with fluorescent PtdCho liposomes exhibit poor engulfment by DCX+ cells in the SVZ (n > 10 fields analysed per experiment; three independent experiments carried out). Scale bar, 5 μm. (d) Wild-type mice injected intravenously with annexin V before and immediately after intracranial injection with fluorescent PtdSer liposomes. Brain tissue examined immunohistochemically for DCX+ and GFAP+ cells containing liposomes in the SVZ. The bar graph represents a quantification of the volume of DCX+ cells containing PtdSer liposomes (mean ± s.e.m.). Student’s t -test statistical analysis was carried out for n = 4 mice in each group with at least five slices analysed for each mouse (°P < 0.05). (e) Representative confocal microscopy images (with n > 30 cells analysed), demonstrating the formation of the phagocytic cup (phalloidin staining) in DCX+ cells around the carboxylate-modified 3 μm beads (simplified apoptotic targets), are shown in top, middle and bottom planes. Scale bar, 3 μm. (f) Representative confocal microscopy images of phagocytosis by a newly differentiated neuron showing orthogonal projections of confocal z stacks (n > 20 fields analysed per experiment; seven independent experiments carried out). Scale bar, 5 μm. (g) Newly differentiated NPC cultures were fed with ultraviolet-irradiated NPCs ex vivo and washed after 6 h. Cells were analysed after a further seven days of differentiation. Representative confocal microscopy orthogonal views of maturated neurons are shown. White arrowheads point to remnants of phagocytosed cells in neurons and grey arrows those in other cells (n > 20 fields analysed per experiment; four independent experiments carried out). Scale bar, 5 μm.

