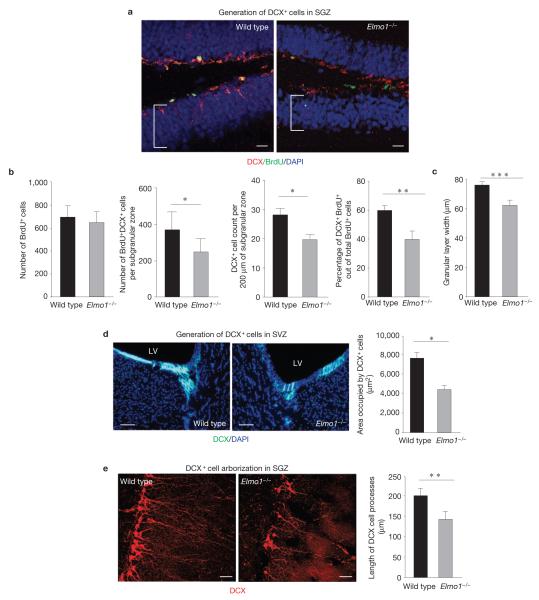
Figure 4.
Effect of ELMO1-dependent phagocytosis of DCX+ cells on neurogenesis in vivo. (a) Representative images of the SGZ from wild-type and Elmo1−/− mice examined for DCX and BrdU immunoreactivity 7 days after BrdU injection. The brackets indicate the width of the granular layer. Scale bars, 20 μm. (b) The bar graphs (means ± s.e.m.) represent the quantification of total numbers of BrdU+ cells (proliferating cells), total numbers of all BrdU+DCX+ cells (neuronal progenitors), total numbers of DCX+ cells per 200 μm of the SGZ (neuronal progenitors, alternative quantification) and percentages of DCX+BrdU+ out of all BrdU+ cells (neuronal differentiation of proliferating cells) per hippocampus in wild-type and Elmo1−/− mice. Student’s t -test statistical analysis was carried out for n = 6 mice in each group with at least ten slices analysed for each mouse (* P < 0.05; *** P < 0.01). (c) Mean (±s.e.m.) width of a granular cell layer. Student’s t -test was carried out for n = 6 mice per group with at least ten slices analysed for each mouse (*** P < 0.001). (d) Representative images of the SVZ immunolabelled for DCX from wild-type and Elmo1−/− mice (LV, lateral ventricle). The bar graph represents quantification of the areas occupied by DCX+ cells per field (mean ± s.e.m.). Student’s t -test statistical analysis was carried out between the groups for n = 6–8 mice in each group with at least ten slices analysed for each mouse (* P < 0.05). Representative experiment out of three independently carried out (n > 10 fields analysed in each experiment). Scale bars, 50 μm. (e) High magnification of the SGZ immunolabelled for DCX+ cells in wild-type and Elmo1−/− mice. The bar graph represents a quantification of dendritic arborization of DCX+ cells in wild-type and Elmo1−/− mice (mean s.e.m.). Student’s t -test statistical analysis was carried out for at least n± 100 DCX+ cells in each group with at least n = 5 mice per group analysed (** P < 0.01). Scale bars, 40 μm.

