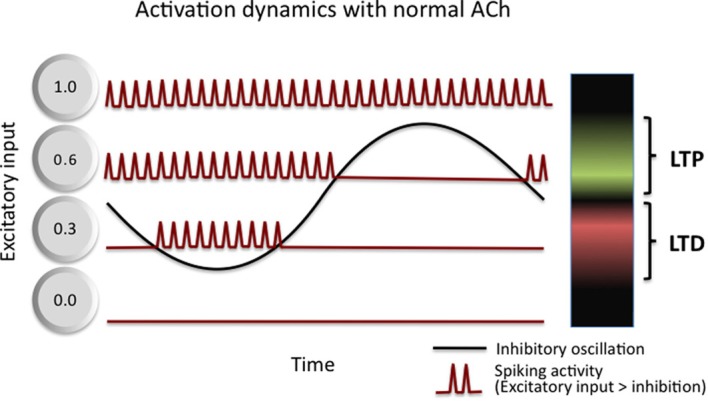
Figure 3.

Activation dynamics and plasticity in Norman et al. (2006) model of theta function. Inhibitory oscillations convert differences in the amount of excitation received by cells within a network into a time (phase) code. Three example cells are shown, each receiving a different amount of excitatory input: 0.0—this cell receives no input and never activates, it incurs no LTP or LTD; 0.3—this cell receives moderate input and activates only during the trough of the oscillations, it incurs LTD as a result; and 0.6—this cell receives strong input and activates during more than half of the oscillation, it incurs LTP as a result. See text for additional details.
