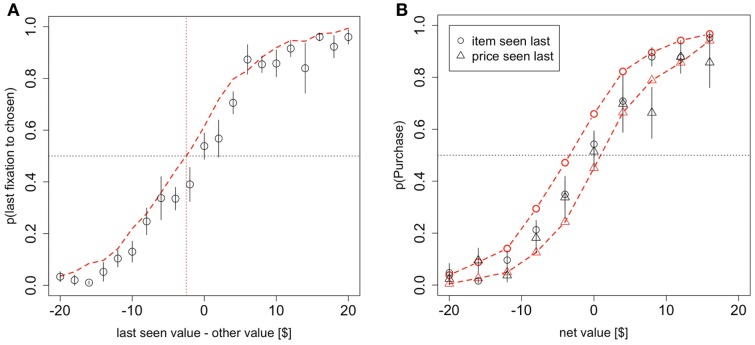
Figure 3.
Model predictions and results. (A) The probability that the last fixation of the trial is to the chosen stimulus (product or money) as a function of the difference in value between the last-seen stimulus and the other stimulus. (B) The probability of purchasing the item as a function of net value, contingent on whether the last fixation was to the product or to the price. Black circles indicate data from the odd-numbered trials of the subject data, and red dashed lines indicate the simulated data from the aDDM. Bars are standard error bars, clustered by subject.

