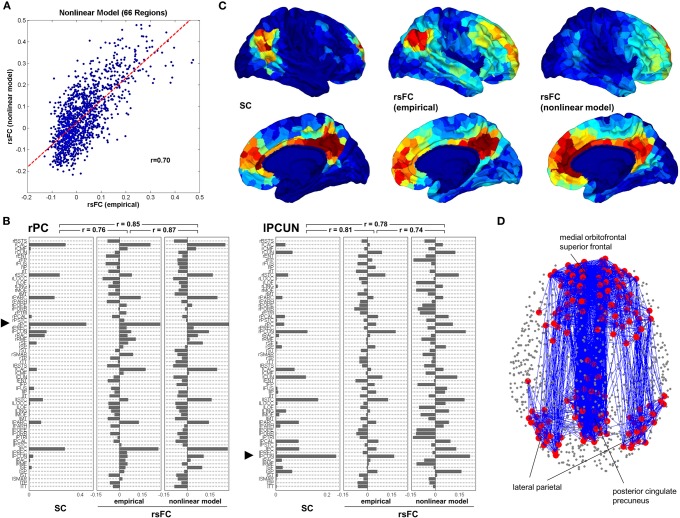
Figure 1.
Computational model of functional connectivity. (A) Scatter plot of empirical resting state functional connectivity versus simulated resting state functional connectivity obtained from the nonlinear model, downsampled to the low resolution. (B) Comparison of structural connectivity, emprirical resting state functional connectivity and nonlinear model of resting state functional connectivity for two single seed regions, the posterior cingulate in the right hemisphere (rPC) and the precuneus in the left hemisphere (lPCUN). (C) Mapping of structural, empirical resting state functional connectivity and modeled resting state functional connectivity within the default mode network (DMN). Within the posterior cingulated/precuneus, medial orbitofrontal cortex and lateral parietal cortex in both hemispheres were selected clusters of five ROIs at positions that most closely matched the coordinates of peak foci of the DMN. These 30 ROIs served as the seeds from which SC and rsFC were determined. (D) Structural connectivity within the DMN. Adapted from Honey et al. (2009).

