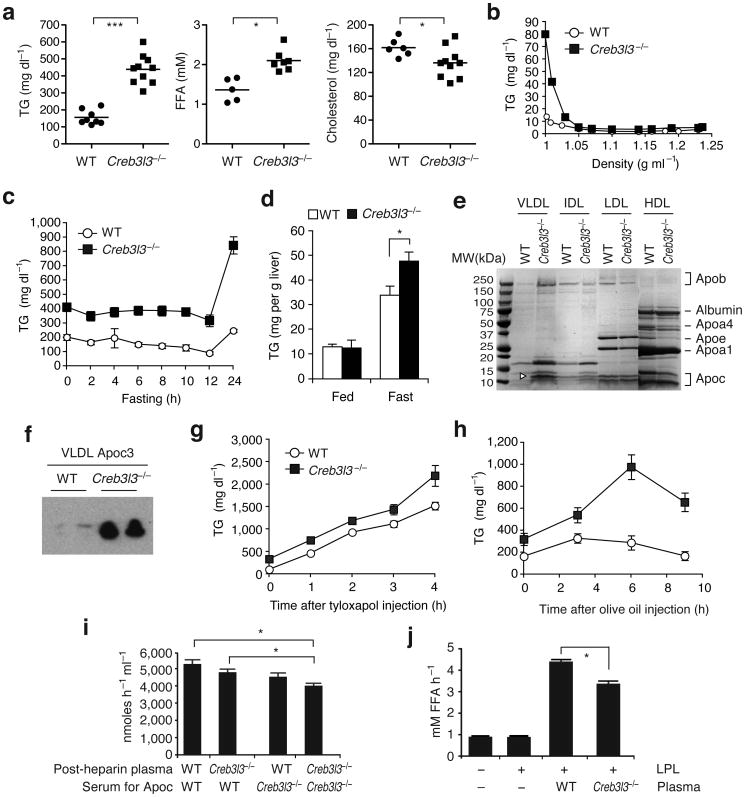
Figure 1. Creb3l3−/− mice display HTG secondary to inefficient TG clearance catalyzed by Lpl.
(a)Plasma TG, FFA, and cholesterol levels measured after a 16 h fast. Each dot represents an individual mouse. (b) We separated lipoproteins by density gradient ultracentrifugation of pooled plasma (n = 3 per each) after a 24 h fast. TG levels in and density of fractions (1 ml each) sequentially collected from top to bottom. (c) Plasma TG levels in WT (n = 9) and Creb3l3−/− (n = 7) male mice deprived of food, starting at 8 AM. (d) Hepatic TG levels measured at fed state or after a 24h fast. n = 5 per group. (e) After concentration, fractions from (b) were separated on a 4–20% gradient SDS-polyacrylamide gels. The gel was stained by Coomassie Brilliant Blue G-250. Arrowhead indicates Apoc3 identified by mass spectrometry. VLDL, d < 1.006 g ml−1; IDL d = 1.006–1.019 g ml−1; LDL, d = 1.019–1.063 g ml−1; HDL, d = 1.063–1.21 g ml−1. (f) Apoc3 western blot of VLDL fractions. (g) Plasma TG concentrations measured after a 4h fasting followed by i.v. injection with tyloxapol (500 mg kg−1). n = 4 per group. (h) Plasma TG concentrations measure after a 16 h fasting followed by oral gavage of olive oil (10 ml kg−1). n = 6 per group. (i) Post-heparin Lpl activity (n = 6 per group) measured in the presence of heat inactivated serum pooled from WT or Creb3l3−/− mice as Apoc sources. (j) Recombinant LPL was incubated with triolein substrate in the presence of plasma collected from WT or Creb3l3−/− mice. Values represent FFA concentration released from triolein. n = 8 per group. *P < 0.05, ***P < 0.0001, compared to WT mice.

