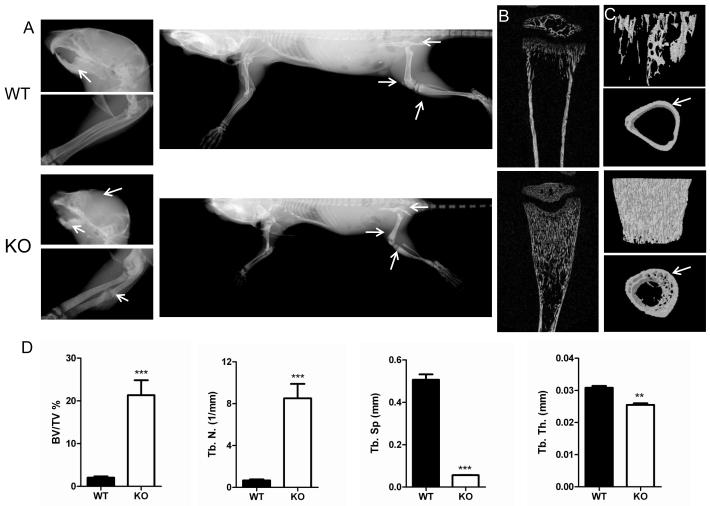
Fig. 2.
Comparative x-ray, microCT and morphometric bone parameters in WT and CSF-1KO mice. A) Representative x-ray images of head (arrows indicate domed skull and sclerotic alveolar bone with unerupted teeth in CSF-1KO), forelimbs (arrows indicate spontaneous fracture in CSF-1KO) and whole body (arrows indicate sclerosis in iliac crest, femoral and tibial metaphysis in CSF-1KO). Representative B) 2-D microCT images of tibias and C) 3-D anterior-posterior microCT views of the tibial metaphyses (upper panel) and cortical bone slices along the diaphysis (lower panel). CSF-1KO mice show dramatically increased trabecular bone and decreased cortical thickness (arrows) compared to WT. D) 3-D trabecular structure parameters calculated in a defined VOI in proximal tibias included: percent bone volume/tissue volume [% BV/TV], trabecular number [Tb.N], trabecular space [Tb. S], trabecular thickness [Tb. Th.]). Bar graphs show Mean ± SE (n = 3-4 mice for each genotype) ***p<0.001, **p<0.01 WT vs CSF-1KO.

