FIG. 5.
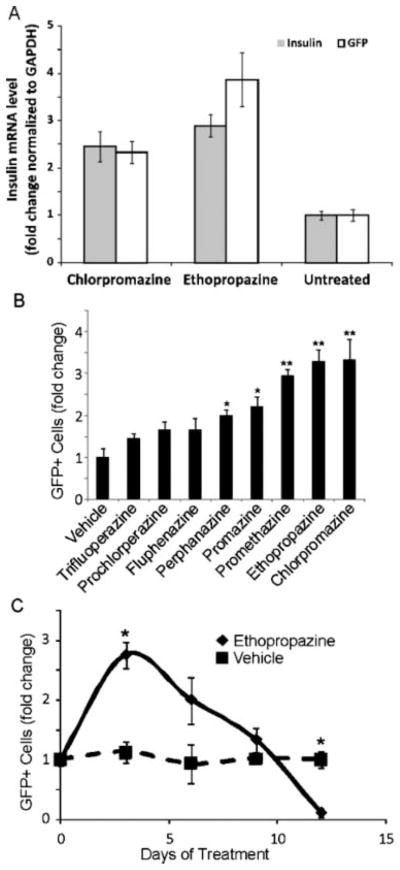
Effect of phenothiazines on insulin promoter activity. (A) Quantitative RT-PCR of green fluorescent protein (GFP) mRNA and endogenous insulin mRNA. Ethopropazine and chlorpromazine increased endogenous insulin mRNA and eGFP mRNA relative to untreated cells. Insulin mRNA levels were normalized to GAPDH. Error bars are SEM of 3 independent experiments. (B) Retesting of all phenothiazines in the NIH/JDRF library for effect on the insulin promoter. Values are expressed as fold change in GFP-positive cells relative to vehicle-treated cells. Each compound is shown at its maximal tolerated dose, which was 20 μM for all compounds except fluphenazine, perphenazine, and trifluoperazine, which were used at 10 μM because of toxicity at higher doses (n = 6; experiment was performed 3 times; error bars are standard error; *p < 0.05, **p < 0.01). (C) Effect of chronic administration of ethopropazine on insulin promoter activity. Ethopropazine (15 μM) was administered to T6PNE cells for 12 days. Media were changed every 3 days. A lower concentration of drug was used than in acute treatment to minimize toxic effects on the cells. Values are expressed as fold change in GFP-positive cells relative to vehicle-treated cells (n = 3; error bars are SEM; *p < 0.05).

