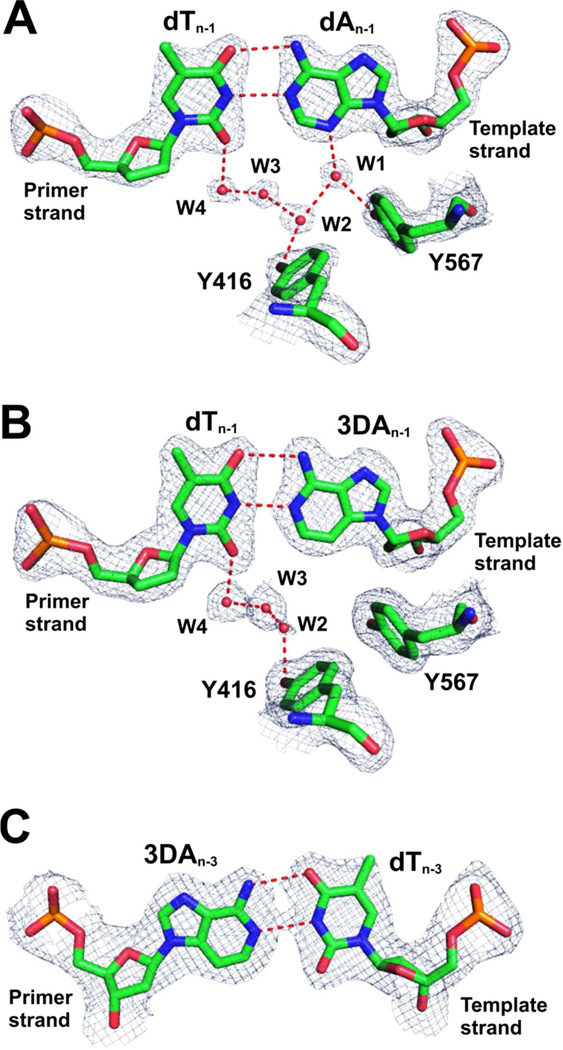
Figure 4.
Structure of base-pairs at the n-1 and n-3 position of the P/T. (A) Final 2Fo-Fc electron density map for the wt RB69pol with control DNA contoured at 1.8 σ. (B) Final 2Fo-Fc electron density map for the wt RB69pol with 3DA at the n-1 position of the template strand contoured at 1.2 σ. (C) Final 2Fo-Fc electron density map for the wt RB69pol with 3DA at the n-3 position of the primer strand contoured at 1.2 σ.

