Figure 2.
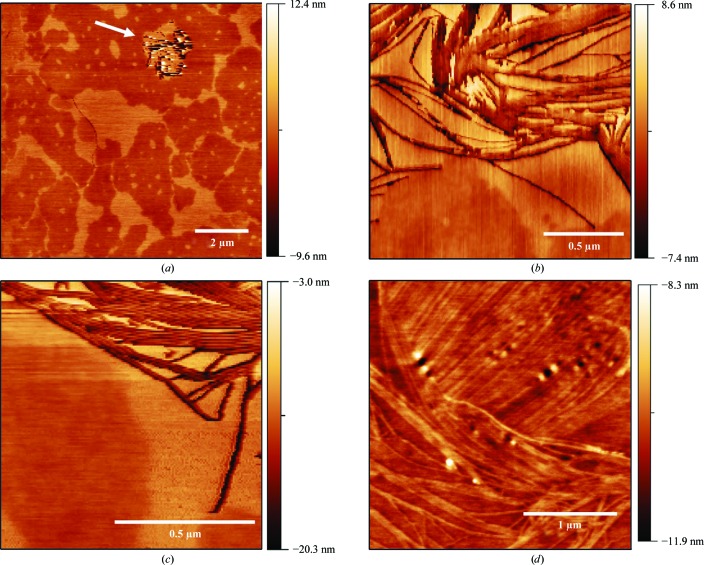
AFM topographies of an HSP17.9 crystal in the solution in which growth took place. (a) Image of the crystal surface, showing terraces, step edges and a depression (indicated by an arrow). (b, c) A closer look at the anisotropic structures found at the depression site. (d) Anisotropic structures located at the top of the crystal.

