
Fig. 2.
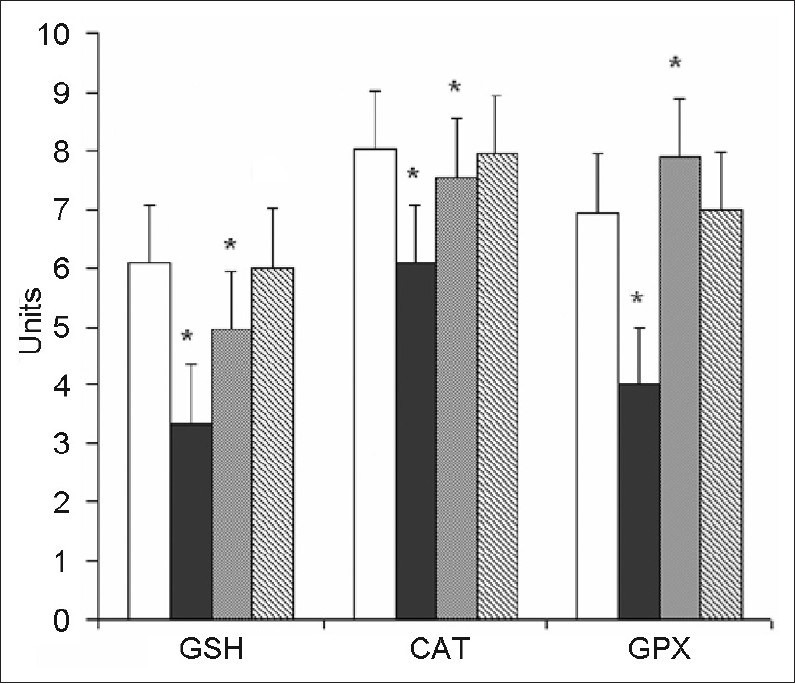
Effect of bacoside-A on the level of reduced glutathione (GSH) and the activities of CAT, and GPx in the brain of control and experimental animals.
Values are expressed as mean±SD; n=6. Morphine group was compared with control group. Bacoside-A pretreated group was compared with morphine group. *P<0.001; GSH - μg/mg protein; CAT - μmole of H2O2 consumed/min/mg protein. GPx - μmoles of glutathione oxidized/min/mg protein.  Control;
  Morphine;
  BAC-A+MR;
  BCA-A
BCA-A