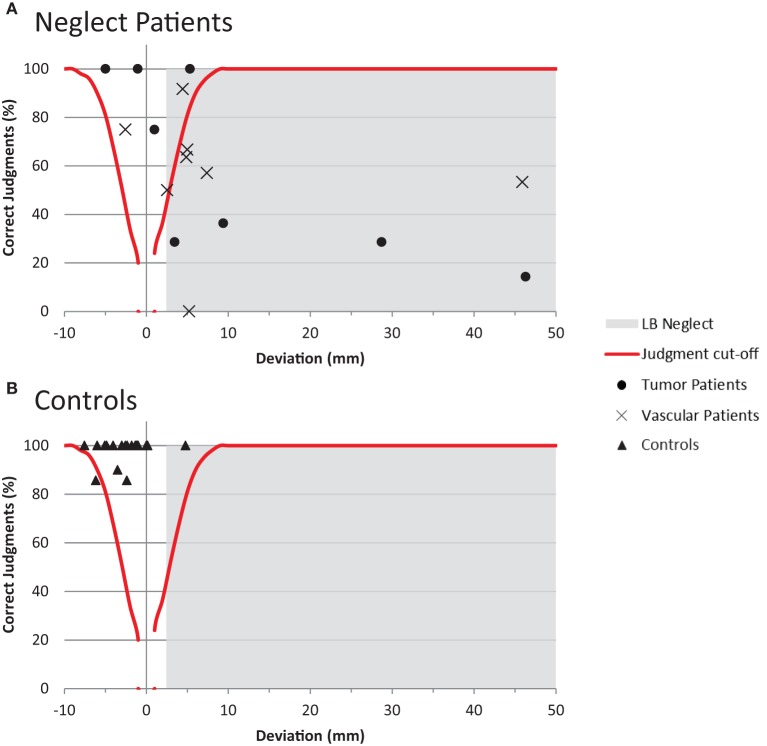
Figure 3.
Disentangling input- and output-related neglect. (A) Shows the performance of the individual patients in the line bisection and error judgment task (split by etiology). Bisection values in the gray colored area indicate the presence of neglect in the line bisection task. Error judgments below the red curve indicate impaired perceptual judgment abilities. See main text for indications of input or output-related neglect (B) Shows the corresponding performance of the control participants.

