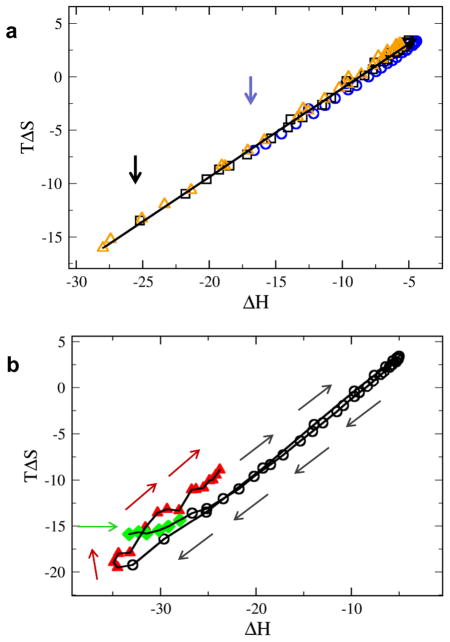
Fig. 3.
Enthalpy-entropy compensation plot. (A) TΔS vs. ΔH plot for N=25 (blue circles); N=30 (black squares); and N=35 (triangles). For each N, flexibility ranges from 3 < kbend < 1000. (B) TΔS vs. ΔH for N=30 and 0.3 < kbend < 5000. The progression of values with increasing flexibility is illustrated by arrows. Values deviate from the compensation line for molecular pairs with high rigidity (kbend > 1000, diamonds) and high flexibility (kbend < 3, triangles).

