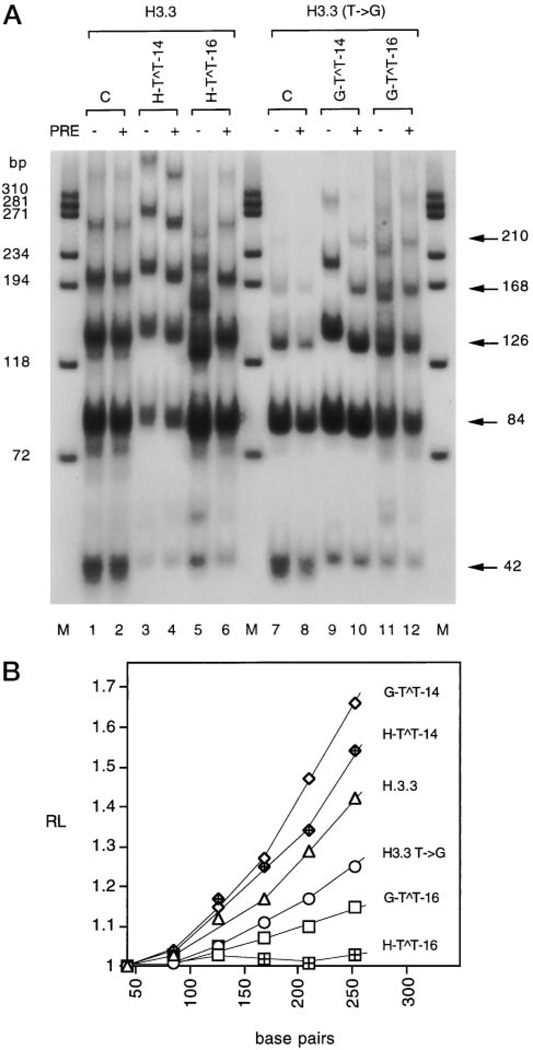
Fig. 5. Analysis of DNA bending of H3.3 and H3.3 T → G arrest sites containing specifically located CPDs.
A, autoradiogram of ligated multimers of damaged H3.3 and H3.3 T → G on 8% nondenaturing polyacrylamide gel. The actual length of ligated multimers in base pairs is shown on the right. Lanes C, ligated multimers of undamaged H3.3 and H3.3 T → G. PRE, photoreactivating enzyme. M, ϕX174 DNA/HaeIII molecular mass markers. B, quantitation of DNA bending. RL is the ratio of the apparent length of the DNA fragment determined by comparison of the ϕX174 DNA/HaeIII molecular mass marker with its actual length.

