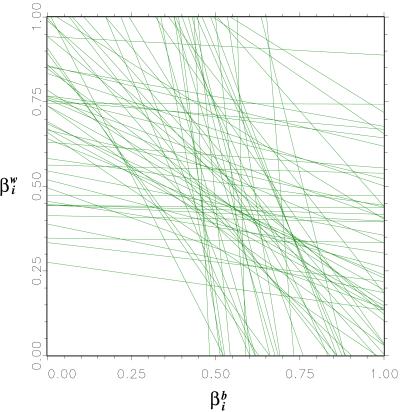
Figure 2.
Tomography plot showing the deterministic information about βib and βiw, given combinations of Ti and Xi in a precinct. The horizontal spread of a line across the [0, 1] interval provides a particular precinct’s deterministic bound on βib. The vertical spread of a line does the same for βiw.

