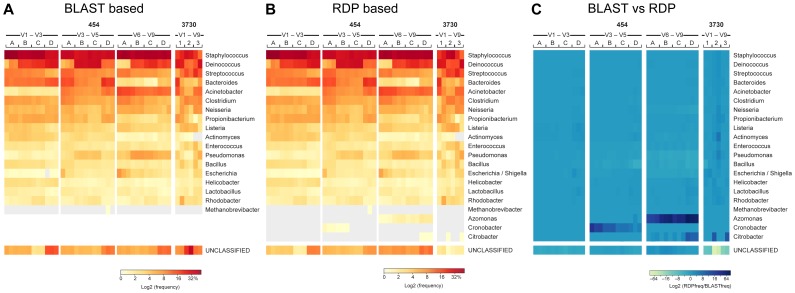
Figure 2. Minor differences in classifiability as measured by the RDP Classifier and a BLASTn-based approach.
. The left panel shows classification based on BLASTn against reference sequences of the MC members. A sequence is classified if it has >95% global sequence identity with one of the reference sequences and >90% of read is contained in the alignable region. Results are shown as a heatmap depicting the frequency values, using a binary logarithm scale. The middle heatmap illustrates frequency values of taxa identified using the RDP classification tool, applying an 80% confidence cutoff. Right panel shows the difference between RDP and BLASTn based classification, with a heatmap representing the ratio of observed genus-level frequency data (RDP) over expected genus-level frequency (BLASTn) for each of the MC members using a binary logarithm scale.

