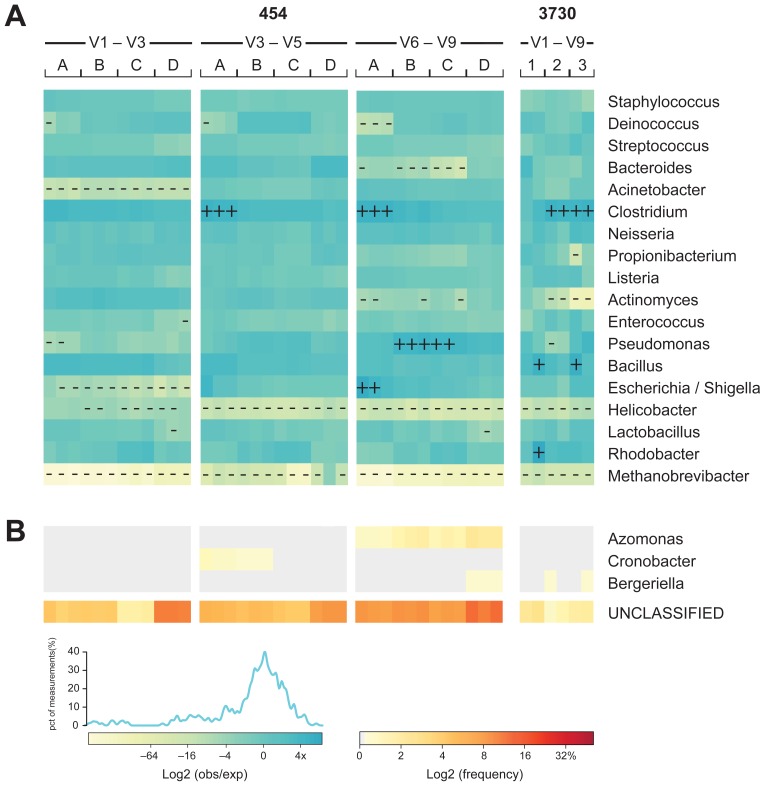
Figure 3. Mock community-based accuracy of community representation compared across technology and 16S window.
The MC was sequenced by different centers on both 3730 and 454 platforms. Each sequencing trial is represented as a column. For 3730 sequencing of the V1–V9 window, amplicons derived from a common amplification protocol were sequenced with short capillaries (1), long capillaries (2), and three reads per clone (3). 454 sequencing was performed by four centers (A, B, C, and D) with three 16S windows (V1–V3, V3–V5, and V6–V9). (A) The observed genus-level frequency data over expected genus-level frequency ratio for each of the MC members is shown as a heatmap using a binary logarithm scale. The expected frequency ratio is based on the whole genome coverages inferred from mapped Illumina WGS reads to the MC reference genome sequences. Genera with observed frequencies differing more than four-fold from expected are marked with + or – for over- or under-representation, respectively. (B) The fraction of misclassified (0.1% of the total combined data set) and unclassified (4.6% of the total combined data set) sequences displayed as a frequency heatmap. The frequency values are depicted as a binary logarithm scale.

