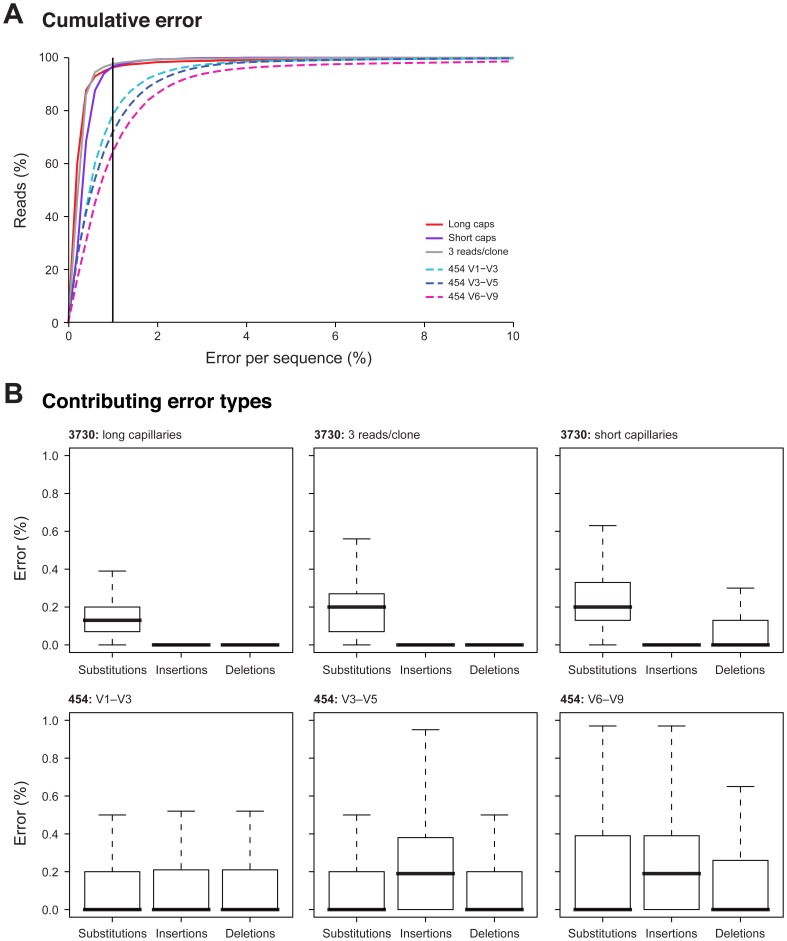
Figure 6. 454 sequences have a higher error rate, mainly resulting from an increased insertion and deletion rate.
(A) For all the quality and chimera filtered 3730 and 454 sequences generated for the MC sample, an alignment-based estimation of errors, including insertions, deletions, and substitutions was performed. For each of the different sequencing approaches, the cumulative frequency distribution of the percent error per sequence is shown for assembled 3730 sequences generated with short capillaries (green), long capillaries (red), and three reads per clone (yellow), and 454 reads spanning the variable regions V1–V3 (light blue), V3–V5 (dark blue), and V6–V9 (fuchsia). A vertical line at 1% was added as a visual aid for upper limit of an acceptable error threshold. (B) Boxplots show the average percentage of errors per read, per sequence approach and per error type, including substitutions, insertions, and deletions. Outliers are not shown.

