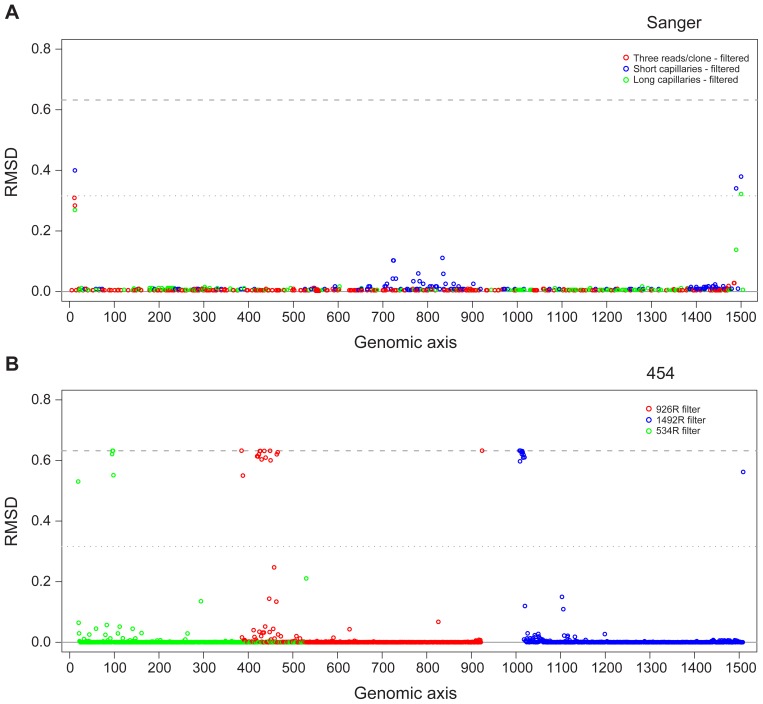
Figure 7. Error by position profiles indicate hotspots for error.
To visualize where sequencing errors were concentrated along the length of the 16S sequence for each sequencing technology, a root mean square deviation (RMSD) plot was generated for (A) 3730 sequence and (B) 454 read data. The RMSD plot is a graphical representation of the differences in nucleotide distribution between a reference sequence and the samples of interest, for each position along the length of the reference. This figure shows the results for Neisseria meningitidis specifically, but is representative of the profiles observed for the other strains in the MC.

