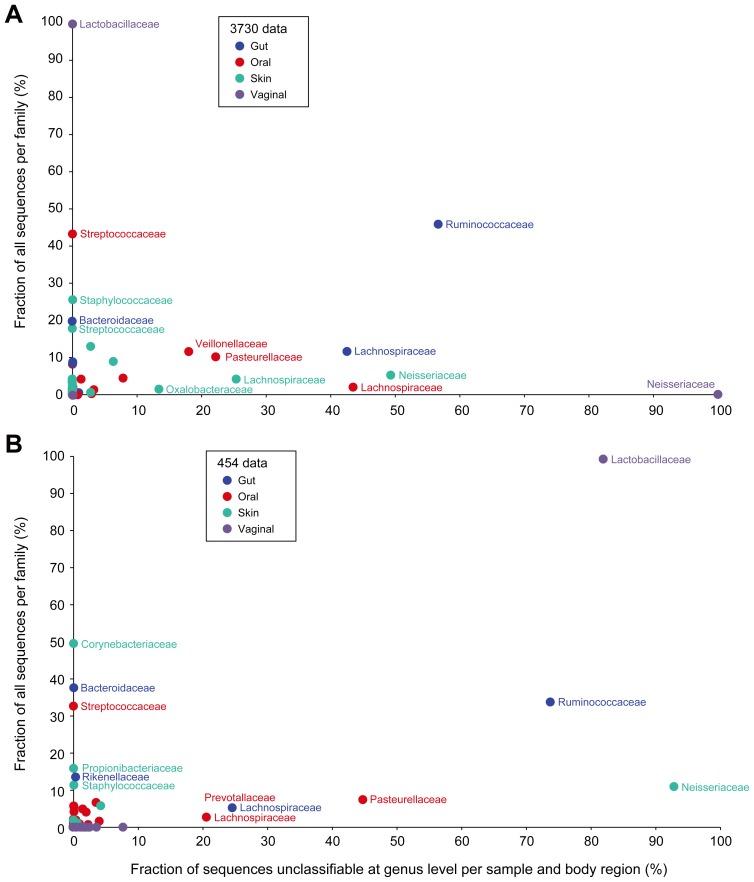
Figure 10. Classifiability of 16S sequence data is differentially impacted by sequencing technology, taxonomic family and body region.
For each of the HMP body regions, the relationship between the average frequency of a given bacterial family (y-axis) versus the contribution of these families to the unclassifiability issue (x-axis) is plotted for (B) 3730 and (C) 454. Only window V3–V5 is presented in 454 results. Classification was performed on quality- and chimera-filtered sequences and classifications assigned only if the RDP Classifier result had a confidence score above 80%.

