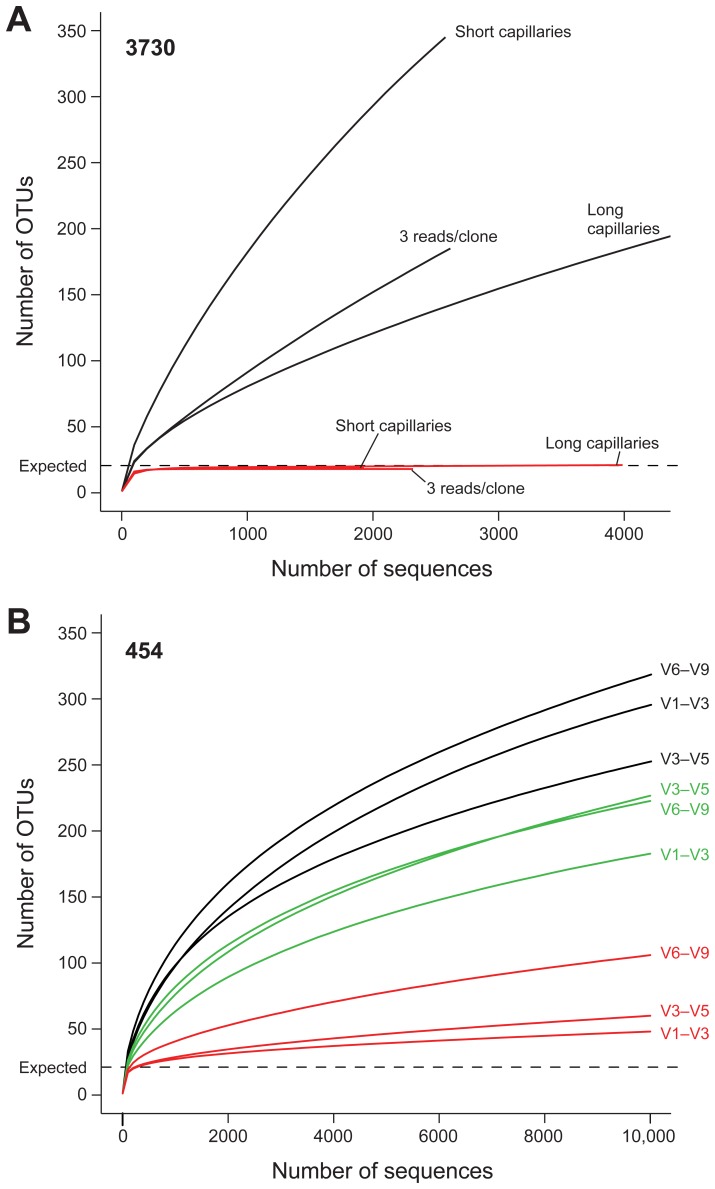
Figure 11. Improved estimation of community diversity after quality filtering and chimera checking, as evaluated by rarefaction analysis.
The number of observed OTUs in the MC is shown as the function of the number of 3730 (A) and 454 (B) sequences, before filtering (black), after quality filtering (green, 454 only), and after combined quality and chimera filtering (red). Rarefaction curves were generated using mothur, with an OTU defined at 97% similarity. (A) For 3730, separate lines show the rarefaction curves for the three different sequencing approaches. (B) For 454, rarefaction curves for the three 16S windows spanning the variable regions V1–V3, V3–V5, and V6–V9 are shown separately, and analysis was performed on a random 10,000-sequence subset from each sample.

