
Fig. 4. Widened sulci current density variations.
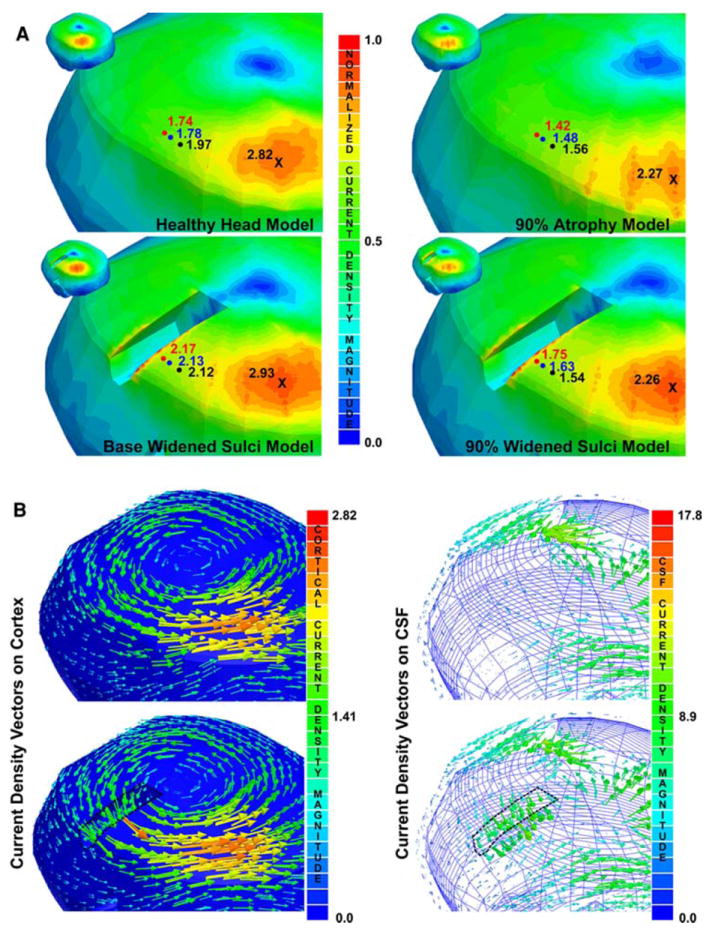
a Current density magnitudes: the current density magnitudes are shown for the base and 90% widened sulci models focused on the region near the central sulcus and in the same locations for the analogous models without the widened sulci in the cortex (i.e., healthy head and 90% atrophy models). Note that the current density magnitudes in the region of the figure-of-eight coil center’s, indicated by the X’s, are consistent for the models with the same % of atrophy. However, the current density magnitudes increase as one gets closer to the widened central sulcus; the black, blue, and red circles indicate analogous points in the models with consistent % atrophies at points 10, 5, and 2.5 mm, respectively. b Current density vector distribution: the left most image shows the vector density distribution on the surface of the cortex for the healthy head and base widened sulci model highlighting the behavior in the central sulcus region. The right most image shows the vector behavior on the surface of the CSF for the healthy head and base widened sulci model. Note that the current density scale is normalized to the maximum current densities for the widened sulci models (i.e., the models on the left are normalized to the maximum cortical current density in the base widened sulci models, 3.06 A/m2, and for the 90% widened sulci model, 2.42 A/m2)