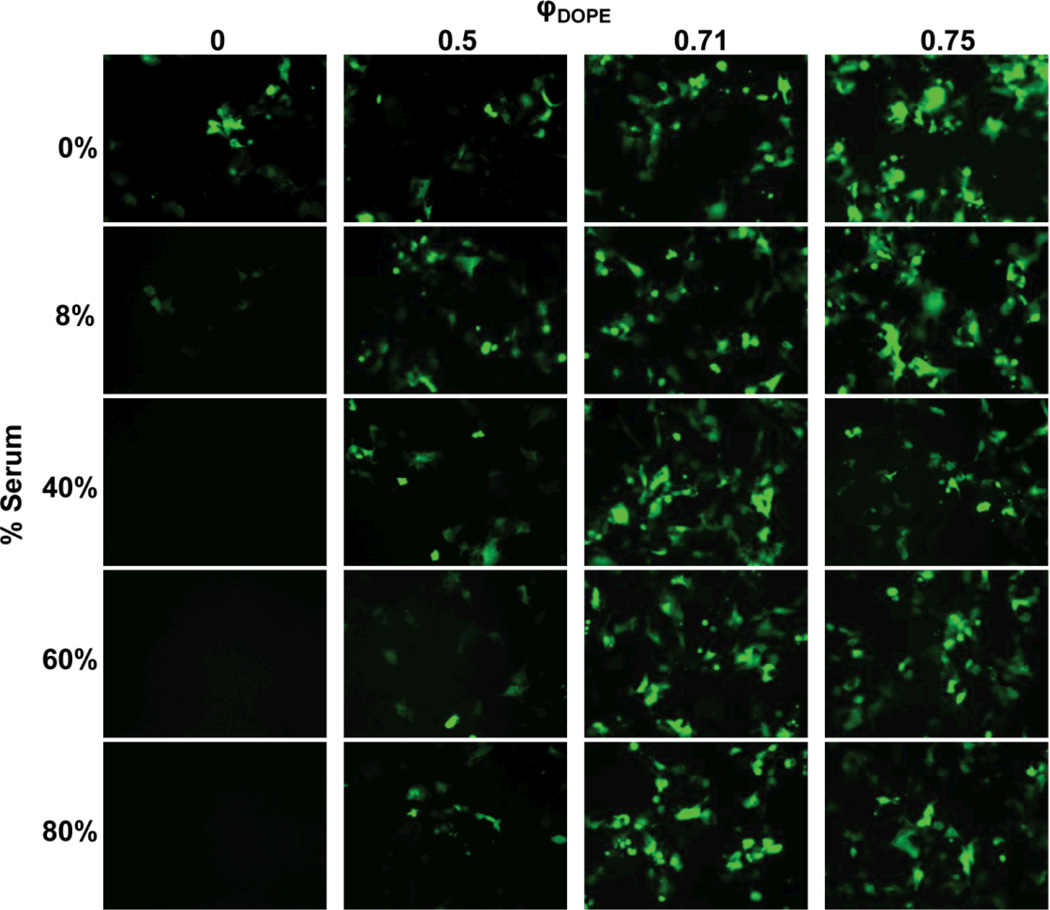
Fig. 2.
Influence of serum on EGFP expression in COS-7 cells treated with lipoplexes formed from pEGFP-N1 and mixtures of reduced BFDMA and DOPE for 4 h. The media used was pure OptiMEM or a mixture of OptiMEM and BS. All experiments were performed by adding 50 µL of lipid/DNA mixture in 1 mM Li2SO4 solution to 200 µL of media in the presence of cells. Final BS concentrations are given down the left hand side of the figure. The overall concentrations of BFDMA and DNA in each lipoplex solution were 8 µM and 2.4 µg/ml, respectively, providing a charge ratio of 1.1:1 (+/−) for all samples as DOPE has a net charge of zero. Mole fractions of DOPE, φDOPE = DOPE/(BFDMA+DOPE), are given across the top of the figure. Fluorescence micrographs (1194 µm by 895 µm) were acquired 48 h after exposure of cells to lipoplexes.

