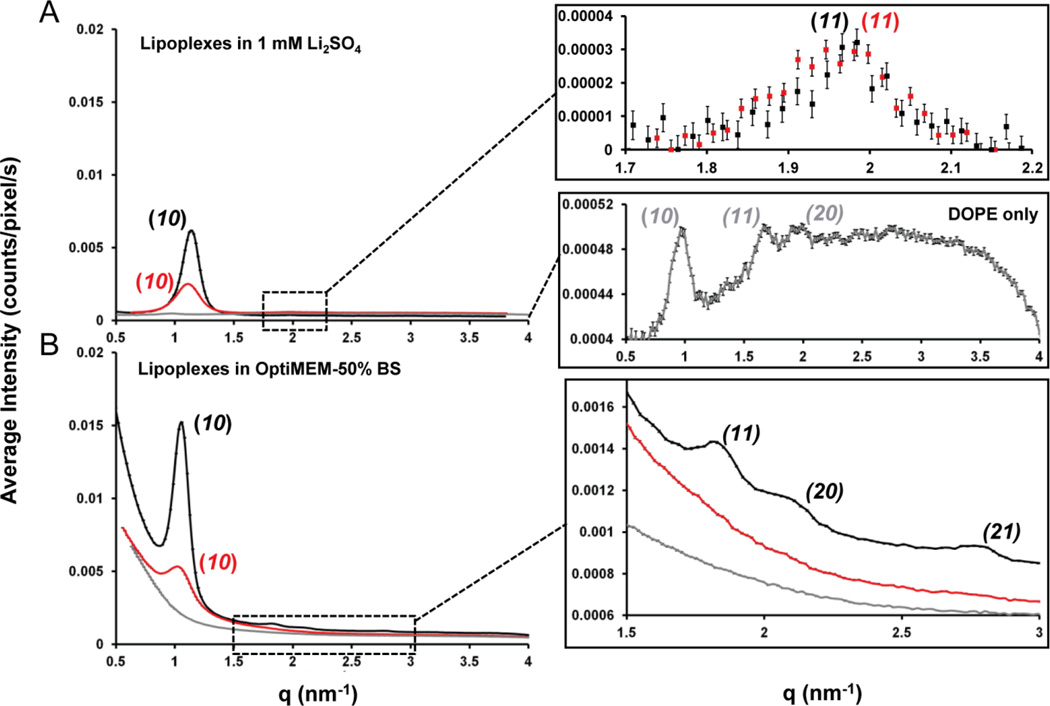
Fig. 4.
SAXS spectra obtained using BFDMARED−DOPE (φDOPE = 0.71) (black), BFDMAOX-DOPE (φDOPE = 0.71) (red) or DOPE only (grey) containing lipoplexes in; (A) 1 mM Li2SO4, using lipid concentrations of 0.87 mM BFDMA and/or 2.17 mM DOPE; (B) OptiMEM with 50% (v/v) BS, using diluted lipid concentrations of 0.32 mM BFDMA and/or 0.8 mM DOPE; all in the presence of pEGFP-N1 (2.0 mg/ml) at a charge ratio of 1.1:1 or 3.3:1 (+/−) for reduced or oxidized BFDMA containing solutions respectively. Inserts for both graphs are given on the right hand side. Bragg peaks are indicated on the graphs and color coded to their respective lipoplex.

