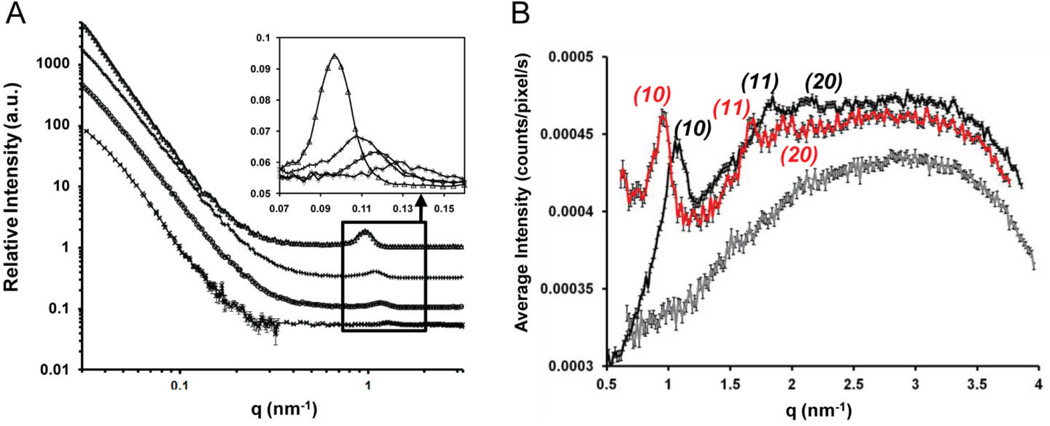
Fig. 5.
Evidence of association of BFDMA and DOPE in solution in the presence and absence of DNA; (A) SANS spectra measured using solutions of; (Δ) 1 mM DOPE (φDOPE = 1); (+) 1 mM BFDMA and 1 mM DOPE (φDOPE = 0.5); (o) 1 mM BFDMA and 0.4 mM DOPE (φDOPE = 0.28), (x) 1 mM BFDMA (φDOPE = 0), all in the presence of DNA (2.9 mg/ml) and, when BFDMA is present, at a charge ratio of 1.1:1 (+/−). The data are offset for clarity. The insert shows an expanded view of the Bragg peaks and has no offset in intensity between samples. (B) SAXS spectra obtained using lipid only solutions of; 1 mM BFDMA (grey); 2.5 mM DOPE (red); 1 mM BFDMA, 2.5 mM DOPE (black); all in 1 mM Li2SO4 (grey).

