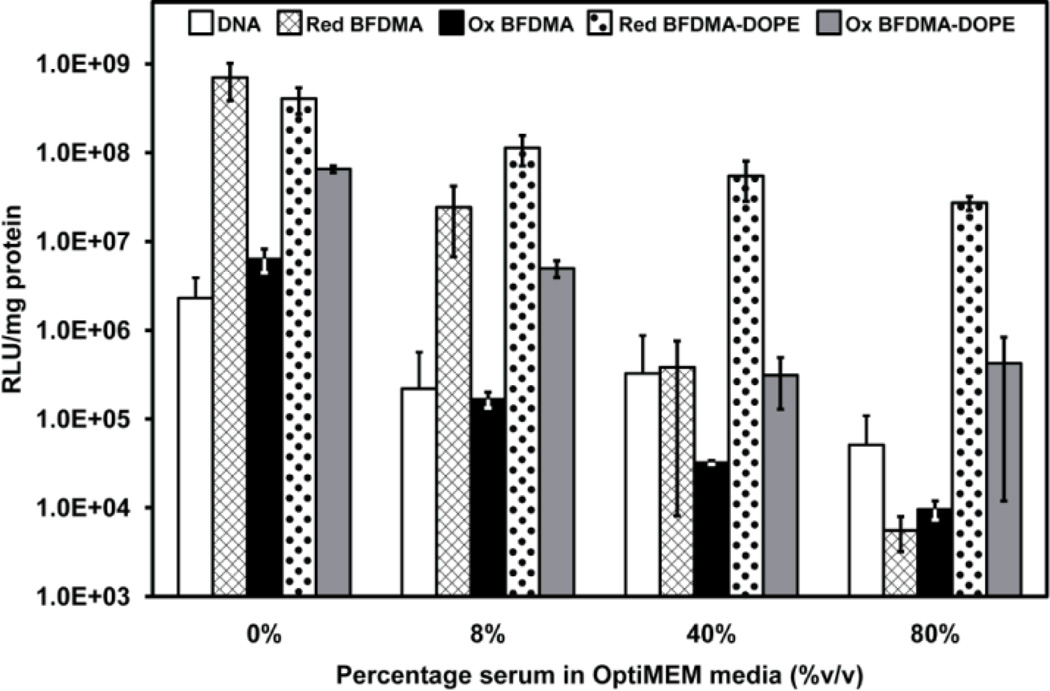
Fig. 6.
Influence of serum on the normalized luciferase expression in COS-7 cells treated with naked DNA (white bars), and lipoplexes of reduced BFDMA (hashed bars), oxidized BFDMA (black bars), reduced BFDMA and DOPE (φDOPE = 0.71, dotted bars), and oxidized BFDMA and DOPE (φDOPE = 0.71, gray bars) for 4 h. All experiments were performed by adding 50 µL of DNA/lipid mixture in 1 mM Li2SO4 solution to 200 µL media in the presence of cells. The media was pure OptiMEM or a mixture of OptiMEM and BS. The final concentration of BS is indicated along the x-axis. DNA was present at a concentration of 2.4 µg/ml in the presence of cells for all samples. 8 µM BFDMA was present in each BFDMA containing sample. Luciferase expression was measured 48 h after exposure to lipoplexes. Error bars represent one standard deviation.

