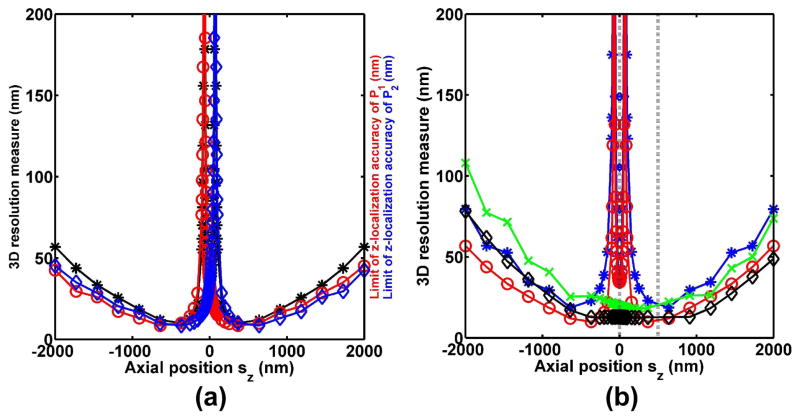
Fig. 6.
(a) Correlation of the 3D resolution measure (i.e., limit of the distance estimation accuracy) (*) for a point source pair with the limit of the z-localization accuracy of each of the point sources P1 (○) and P2 (◇) in the pair. The resolution measure curve corresponds to the 2D slice d = 200 nm from Fig. 3(b) (i.e., the SEP-SNG modality). (b) Dependence of the 3D resolution measures for the SIM-SNG (*), the SEP-SNG (○), the SIM-MUM (×), and the SEP-MUM (◇) modalities on the axial position sz of the imaged point source pair. The curves shown correspond to the 2D slice d = 200 nm from each of the four 3D plots of Fig. 3. The dashed vertical line at sz = 0 nm marks the focal plane of the SIM-SNG and the SEP-SNG modalities, and focal plane 1 of the SIM-MUM and the SEP-MUM modalities. The dashed vertical line at sz = 500 nm marks focal plane 2 of the SIM-MUM and the SEP-MUM modalities. In both (a) and (b), all experimental, noise, and other point source pair parameters are as given in Fig. 3.

