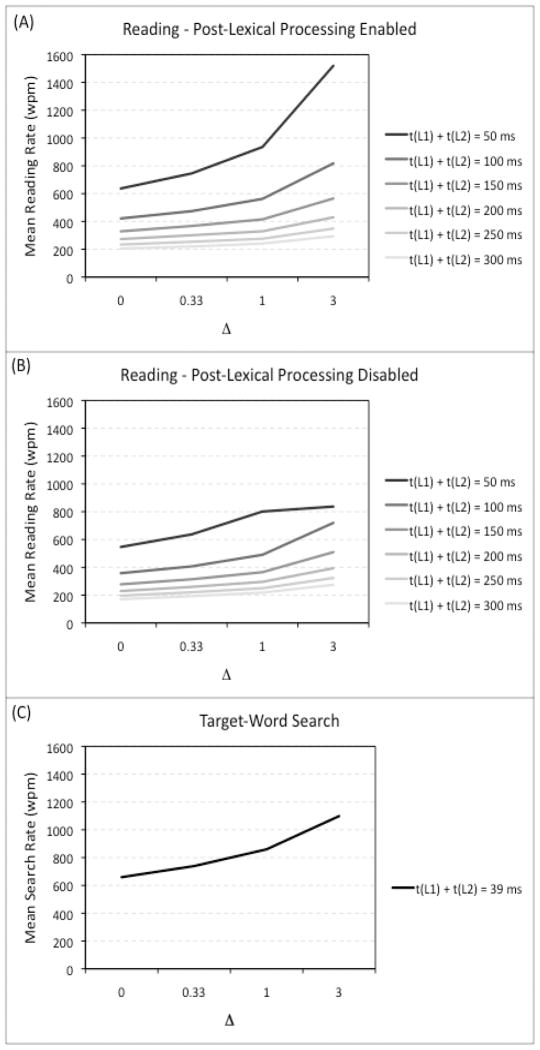
Figure 3.
Panel A: Results of Simulation 1, which examined how the absolute and relative times to complete L1 and L2 affected reading rate (in words per minute, wpm) with post-lexical processing disabled. Panel B: Results of Simulation 1, which examined how the absolute and relative times to complete L1 and L2 affected reading rate (in words per minute, wpm) with post-lexical processing enabled. Panel C: Results of Simulation 2, which examined how the absolute and relative times to complete L1 and L2 affected target-word search rate (in words per minute, wpm). Note that task performance is shown on a common scale to facilitate between-task comparisons.

