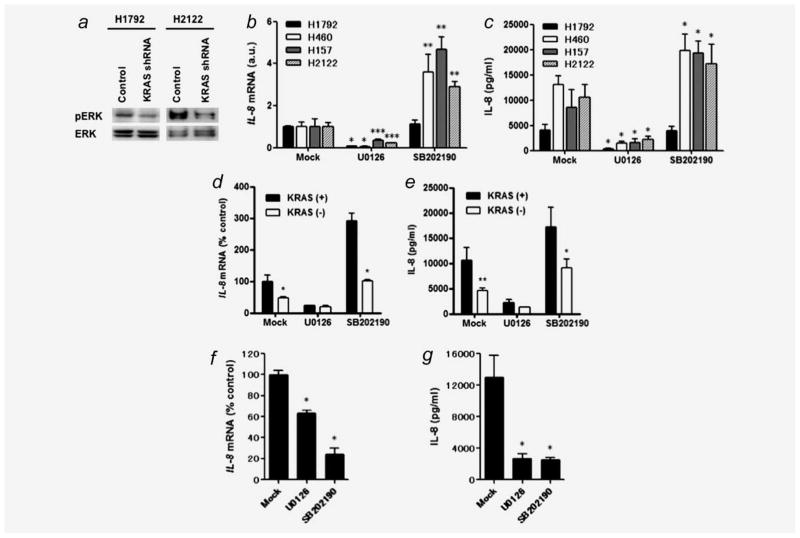
Figure 4.
(a) shRNA-mediated KRAS knockdown reduces phosphorylated ERK levels in H1792 and H2122 cells. Thirty microgram of whole cell lysate was loaded per lane, and western blots were performed using total ERK expression levels as a loading control. (b) Effects of U0126 and SB202190 on IL-8 mRNA expression in KRAS mutant/IL-8 overexpressing NSCLC cell lines. Twenty-four hour after 5 × 10⁵ cells were plated in each well of 6-well plates, cultured medium was replaced with 2 ml of the growth medium with U0126 (10 μM) or SB202190 (10 μM). After additional culture for 24 hr, cells were harvested for real-time RT-PCR analysis. Columns represent means ± SD from four independent experiments. *p < 0.01, **p < 0.001, ***p < 0.05 for comparisons of the treatment with DMSO alone (Mock) to the treatment with U0126 or SB202190 on each cell line by ANOVA with multiple comparisons. (c) Effects of U0126 or SB202190 on IL-8 protein expression from KRAS mutant/IL-8 overexpressing NSCLC cells. After treatments with U0126 or SB202190 for 24 h, cultured medium was collected, and IL-8 concentration was determined by ELISA. Columns represent means ± SD from four independent experiments. *p < 0.001 for comparisons of the treatment with DMSO alone (Mock) to the treatment with U0126 or SB202190 on each cell line by ANOVA with Bonferroni multiple comparisons. Effects of KRAS knockdown on IL-8 expression at (d) mRNA and (e) protein levels in H2122 cells treated with U0126 or SB202190. IL-8 levels were determined at 24 hr posttreatment. Columns represent means ± SD from four independent experiments. *p < 0.001, **p < 0.01 for comparison between mutant KRAS-disrupted cells (white square) and mutant KRAS-expressing (pRS vector-infected) cells (black square) on each treatment by ANOVA with Bonferroni multiple comparisons. Effects of U0126 and SB202190 on IL-8 expression at (f) mRNA and (g) protein levels in HCC827 cells. The experimental procedures and conditions were the same as Figures 4b and 4c. *p < 0.001 for comparisons of the treatment with DMSO alone (Mock) to the treatment with U0126 or SB202190 by ANOVA with Bonferroni multiple comparisons.

