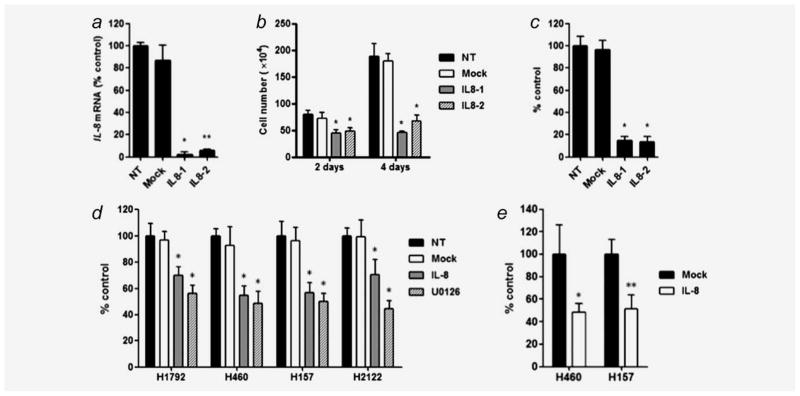
Figure 5.
(a) siRNA mediated knockdown of IL-8 expression in H1792 cells as evaluated by quantitative RT-PCR. NT: treatment with medium alone; Mock: treatment with Tax siRNA as a negative control. Two siRNAs targeting different sites of IL-8 mRNA (IL8-1 and IL8-2) were used to knockdown IL-8. Columns represent the mean ± SD from four independent experiments. *p < 0.001, **p < 0.01 for comparisons between NT and each siRNA treatment by Kruskal–Wallis test with Dunn’s multiple comparisons. siRNA-mediated IL-8 knockdown inhibited cell proliferation and colony formation as evaluated by (b) cell growth analysis using trypan-blue staining and (c) colony formation assay in H1792 cells. Columns represent the mean ± SD from six independent experiments for cell growth analysis and three independent experiments for colony formation assay. *p < 0.001 for comparison between NT and each siRNA treatment by ANOVA with Bonferroni multiple comparisons. (d) IL-8 neutralization mediated by an IL-8 antibody inhibits cell proliferation of KRAS mutant/IL-8 overexpressing NSCLC cell lines as evaluated by MTT assay. Cells were treated with medium alone (NT), IgG1 control antibody (Mock; 10 μg/ml), IL-8 antibody (IL-8; 10 μg/ml) and U0126 (10 μM) for 72 hr. *p < 0.001 for comparison between NT and each treatment by ANOVA with Bonferroni multiple comparisons. Columns represent the mean ± SD from replicates of eight from two independent experiments (e) IL-8 neutralization inhibits cell migration of H460 and H157 cells. *p < 0.01; **p < 0.05 for comparison between Mock and IL-8 antibody treatments by unpaired t-test. Columns represent means ± SD from three independent experiments.

