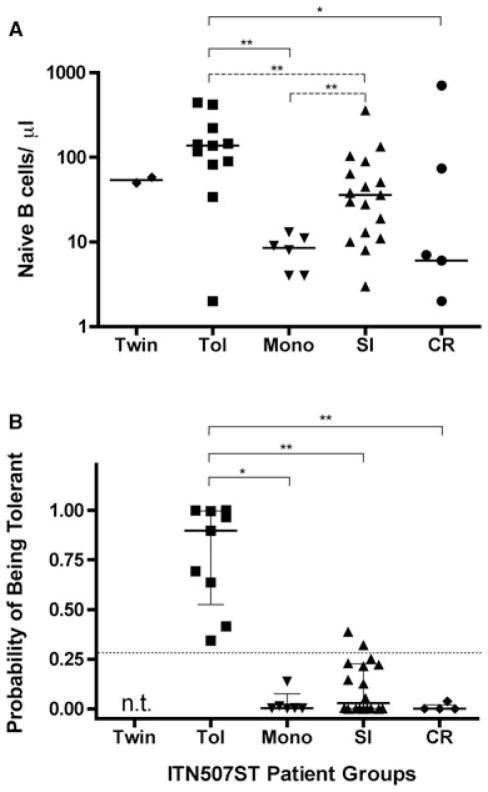
Figure 2. Naive B-cell counts and cross-platform probabilitÿ of being tolerant scores.
(A) Naïve B-cell number (CD19+CD27-IgM+IgD+) in fresh peripheral blood of the 45 patients analyzed in Figure 1. (B) Probability of being tolerant, estimated according to the Indices of Tolerance model of 14 biomarkers, including B-cell parameters and direct pathway T-cell parameters (11). Subjects in the TWIN group were not tested (n.t.). All panels: Individual results from each subject (individual symbols) and group median (horizontal line) with quartiles (panel B only) are shown. Significant differences between groups using pair-wise comparisons, *p < 0.05 and **p < 0.01; Dunn’s correction for multiple comparisons shown in solid lines, unadjusted Mann–Whitney U test comparisons shown with dotted lines.

