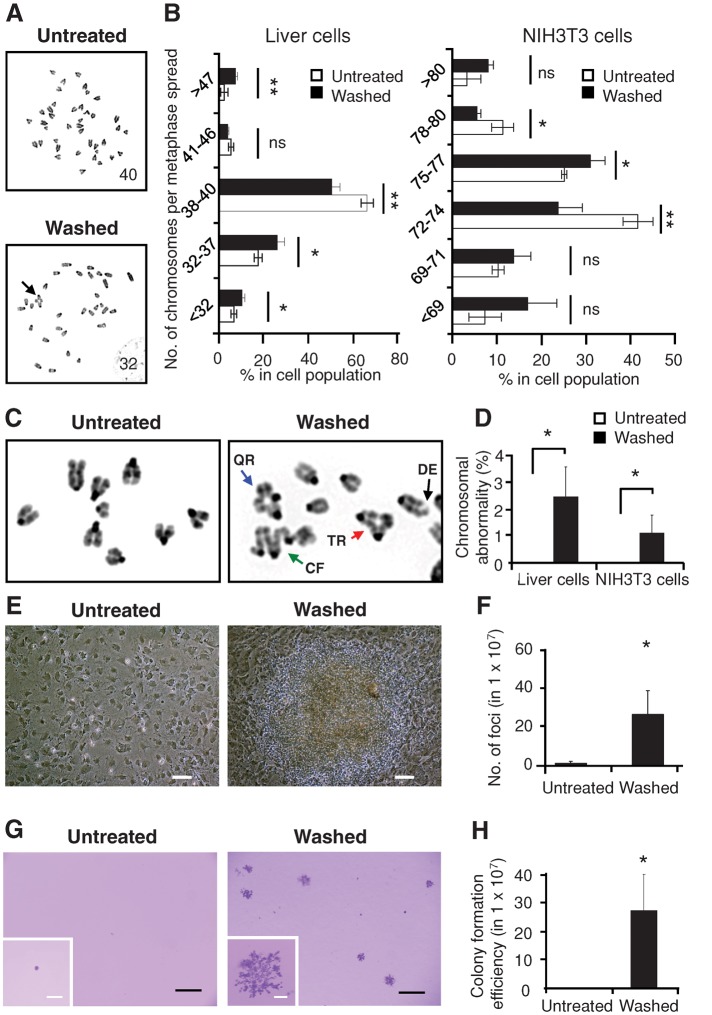
FIGURE 4:
Genetic alterations and transformation after reversal of apoptosis. (A) Inverted DAPI-banding image of metaphase spreads of untreated liver cells (Untreated) compared with cells that were treated with 4.5% ethanol for 5 h, washed, and then cultured for 3 d after removal of apoptotic inducer (Washed). The number of metaphase chromosomes is indicated on the corresponding images. An abnormal chromosomal configuration is indicated by an arrow. (B) Percentage of untreated and washed liver cells (3 d after 5-h exposure to 4.5% ethanol) and NIH 3T3 cells (3 d after 20-h exposure to 10% DMSO) displaying the indicated number of chromosomes in metaphase spreads. ns, p > 0.05; *p < 0.05; **p < 0.01; n = 3 independent experiments. Error bars denote SD. (C) Representative inverted DAPI-banding images of the configuration of metaphase chromosomes of untreated (Untreated) as well as treated and washed (Washed) liver cells. Configurations indicated by arrows: triradial (TR, red); quadriradial (QR, blue); complex figures (CF, green); deletion (DE, black). (D) Percentage of the untreated and the washed liver and NIH 3T3 cells displaying at least one abnormality in chromosomal configuration. *p < 0.05; n = 3 independent experiments. Error bars denote SD. (E) Image of untreated NIH 3T3 cells and the foci from the cells after being treated and washed (Washed) after 3 wk of culture. Scale bars: 50 μm. (F) Number of foci in untreated as well as treated and washed NIH 3T3 cells after 3 wk of culture. *p < 0.05; n = 3 independent experiments. Error bars denote SD. (G) Image of crystal violet–stained colonies in soft agar in untreated as well as treated and washed NIH 3T3 cells from the foci after 5 wk of culture. Inset, enlarged image of a colony. Scale bars, 400 μm (white), 2 mm (black). (H) Number of colonies formed in soft agar in untreated as well as treated and washed NIH 3T3 cells after 5 wk of culture. *p < 0.05; n = 3 independent experiments. Error bars denote SD.

