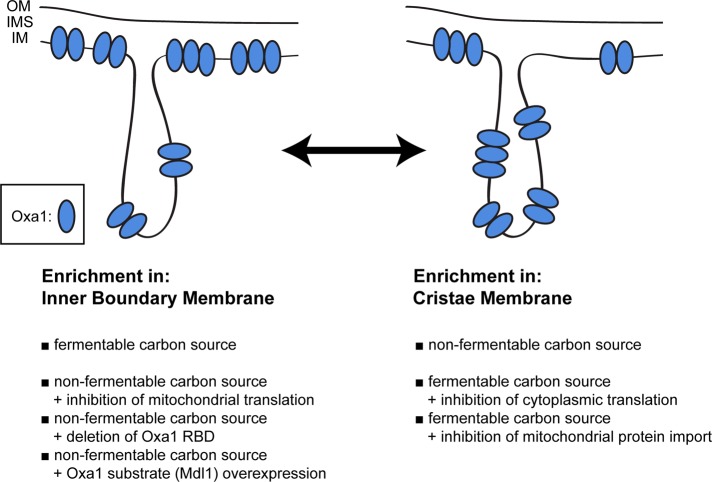
FIGURE 6:
Schematic representation of the factors that influence the distribution of Oxa1 between the IMB and the CM. Oxa1 is enriched in the IBM when grown on a fermentable carbon source and redistributed to the CM upon a change to a nonfermentable carbon source. These distributions can be influenced by various means, as listed. IM, inner membrane; IMS, intermembrane space; OM, outer membrane.

