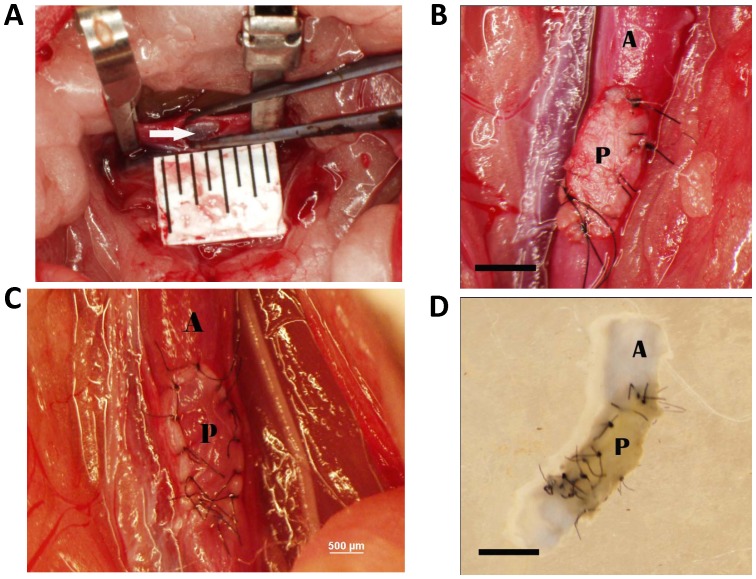
Figure 1. Photomicrographs of the implanted pericardial patch.
A) The rat aorta after arteriotomy and prior to patch placement; the white arrow shows the glistening intima on the posterior wall; ruler markings are 1mm. Scale bar, 1000 microns. B) Completed bovine patch closure. Scale bar, 1000 microns. C) Completed porcine patch closure. Scale bar, 500 microns. D) Explanted aortic segment containing patch after harvesting and flushing. Scale bar, 1000 microns. In each graph, A = aorta; P = pericardial patch.

