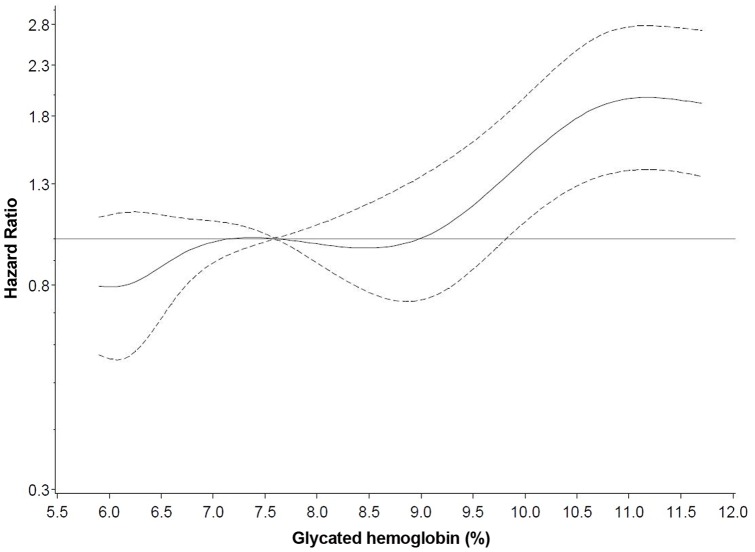
Figure 2. Adjusted Hazard Ratios of Death according to Glycated Hemoglobin (%) Measured in Stored Erythrocytes among 4,345 Individuals with Diabetes.
Solid lines indicate hazard ratios and dashed lines indicate 95% confidence intervals derived from restricted cubic spline regression, with knots placed at the 5th, 10th, 25th, 75th, 90th, and 95th percentiles of the distribution, using the 50th percentile as a reference. Age- and study center-stratified models were adjusted for sex, storage time, disease duration, diabetes medication use, co-morbidities, physical activity, smoking status, educational attainment, body mass index, and systolic blood pressure. P value for nonlinearity derived from a Wald Chi-square test was P=0.15.

