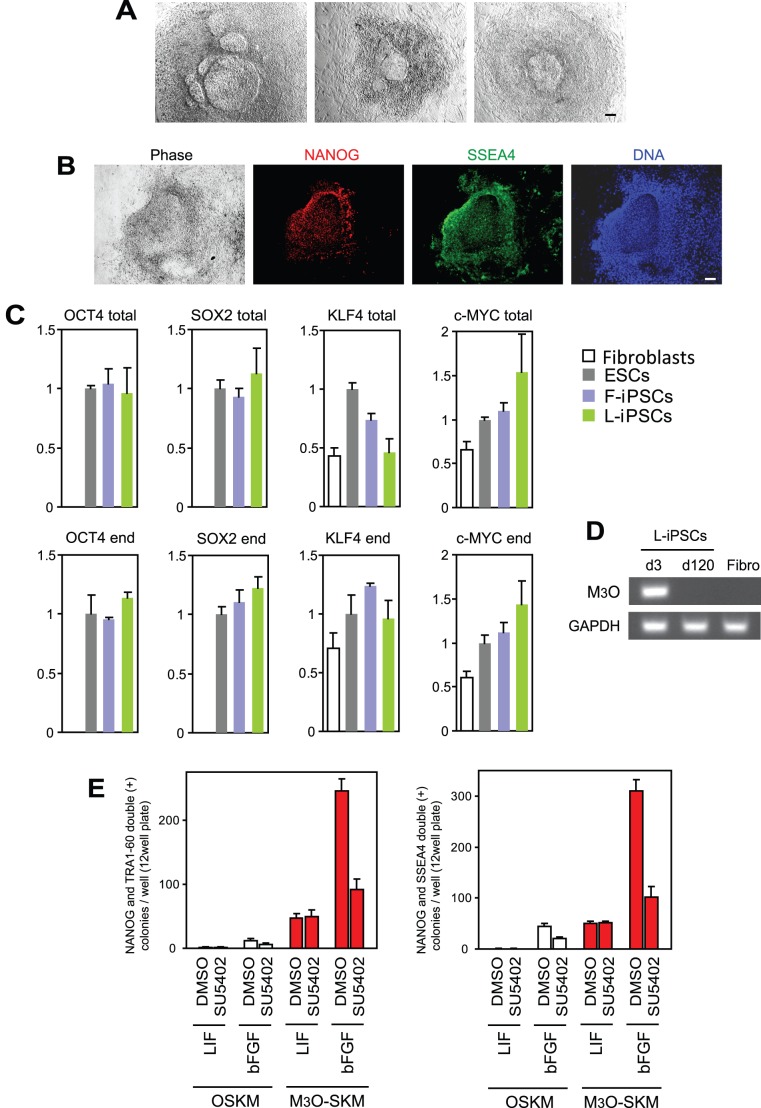
Figure 2. Characterization of colony morphology, gene expression patterns, and sensitivity to an FGF receptor inhibitor in L-iPSCs obtained with M3O-SKM.
(A) Phase contrast images of L-iPSC colonies obtained on day 90. Bar, 100 µm. (B) Immunofluorescence staining of an L-iPSC colony with antibodies against NANOG and SSEA4 on day 28. Bar, 100 µm. (C) Quantitative RT-PCR analysis of the OCT4, SOX2, KLF4 and c-MYC genes in various pluripotent stem cells on day 120. Expression levels of each gene were normalized to GAPDH. The normalized value for ESCs was defined as 1.0. Mean + SD obtained from three independent experiments are shown. (D) RT-PCR analysis of the expression of M3O in day-3 fibroblasts transduced with M3O-SKM, day-120 L-iPSCs, and parent fibroblasts. Expression of GAPDH mRNA was monitored as a control. Bar, 100 µm. (E) Effects of SU5402 on iPSC colony formation with LIF and bFGF. SU5402 dissolved in dimethyl sulfoxide (DMSO) was added to culture medium between day 8 and 10, and the colonies were counted on day 12. DMSO was used as a control.

