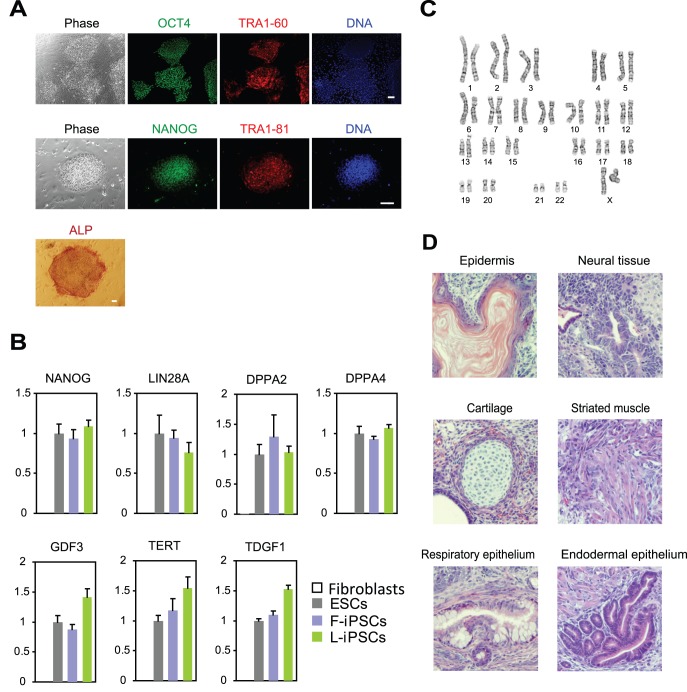
Figure 3. Characterization of gene expression patterns, karyotype, and teratoma formation in L-iPSCs prepared with M3O-SKM.
(A) Immunofluorescence staining of L-iPSCs with antibodies against OCT4, NANOG, TRA1-60 and TRA1-81 on day 120. Alkaline phosphatase staining is also shown. Bar, 100 µm. (B) Quantitative RT-PCR analysis of genes that are typically expressed in pluripotent stem cells. Expression levels of each gene were normalized to GAPDH. The normalized value for ESCs was defined as 1.0. Mean + SD obtained from three independent experiments are shown. (C) Karyotype analysis of an L-iPSC on day 120. (D) Haematoxylin and eosin staining of histological sections of teratomas derived from L-iPSCs. Bar, 200 µm.

