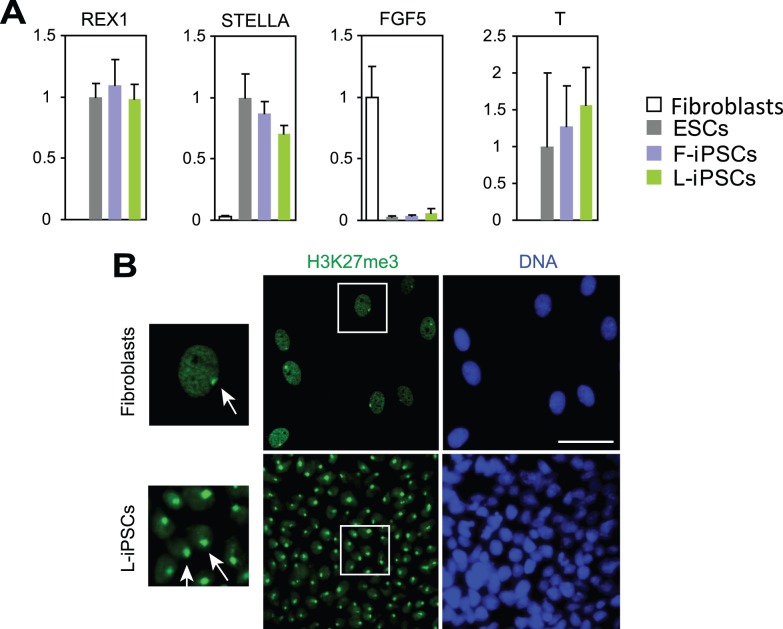
Figure 4. Characterization of L-iPSCs by using gene expression analyses and immunofluorescence staining of H3K27me3.
(A) Quantitative RT-PCR analysis of genes that are typically expressed in mouse naïve (REX1 and STELLA) or primed (FGF5 and T) pluripotent stem cells. Expression levels of each gene were normalized to GAPDH. The normalized value for ESCs was defined as 1.0. Mean + SD obtained from three independent experiments are shown. (B) Immunofluorescence staining of H3K27me3 as an indicator for X chromosome inactivation. Parent fibroblasts were stained as a positive control. Nuclei surrounded by squares were magnified (left panels). Arrows indicate H3K27me-positive areas, corresponding to inactive X chromosomes. Bar, 50 µm.

