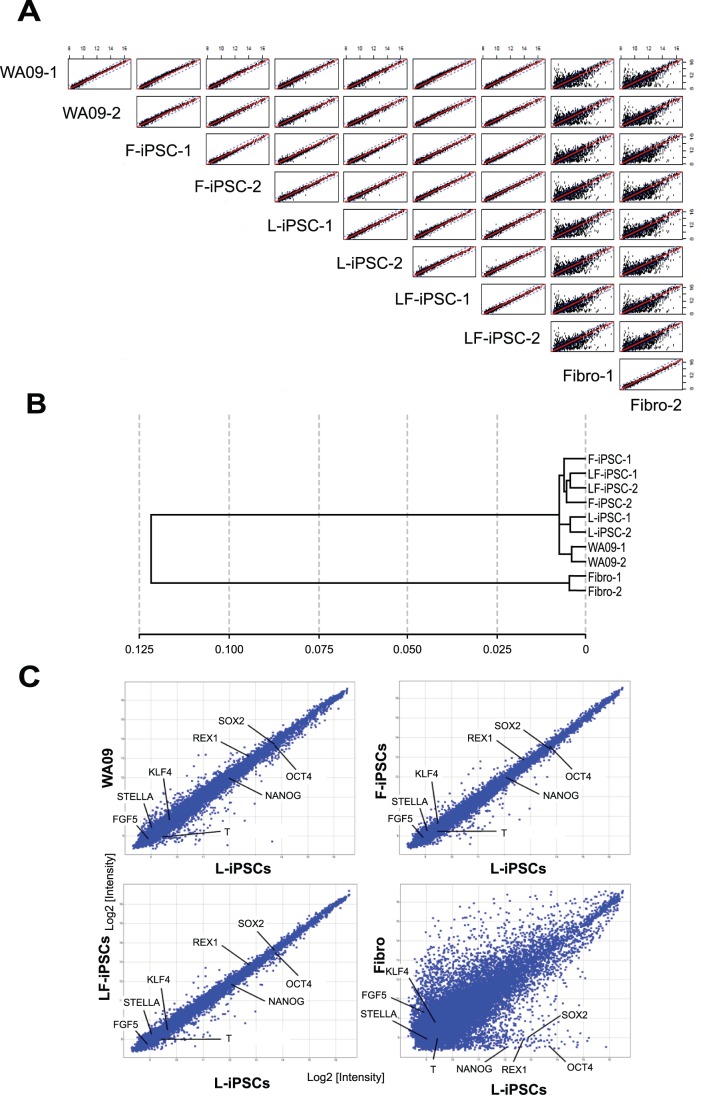
Figure 6. Genome-wide gene expression patterns comparing various pluripotent stem cells.
(A) Scatter plots comparing levels of whole transcripts obtained from two WA09 ESC cultures, two dermal fibroblast cultures, two lines each for L-iPSCs, F-iPSCs and LF-iPSCs. Two independently cultured cells were used for WA09 cells. All these iPSCs were established from fibroblasts obtained from a single adult female. Two different cultures of fibroblasts obtained from the same individual were used. (B) Cluster analysis of the genome-wide gene expression patterns of cells analyzed in (A). (C) Scatter plots comparing levels of whole transcripts between L-iPSCs and other cell types used in this study. Average values obtained from two cultures or two lines for each cell type were used.

