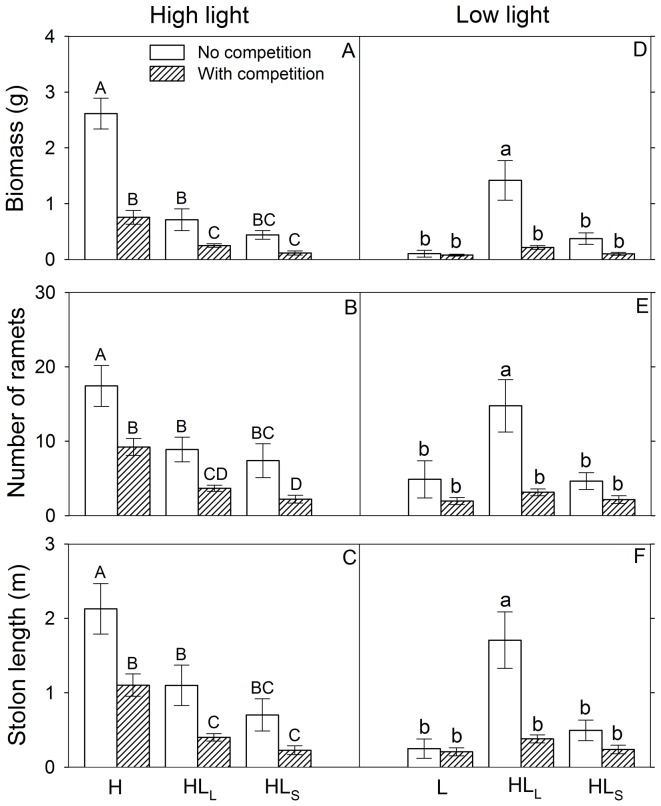
Figure 4. Effects of competition and light heterogeneity on growth measures of Duchesnea indica.
Bars in the left panels (A–C) are mean values (+SE) of three growth measures in the high light patches and bars in the right panels (D–F) are those in the low light patches. Bars sharing the same letters are not different at P = 0.05. Bars are mean values (+SE). Treatment codes are in Figure 1.

