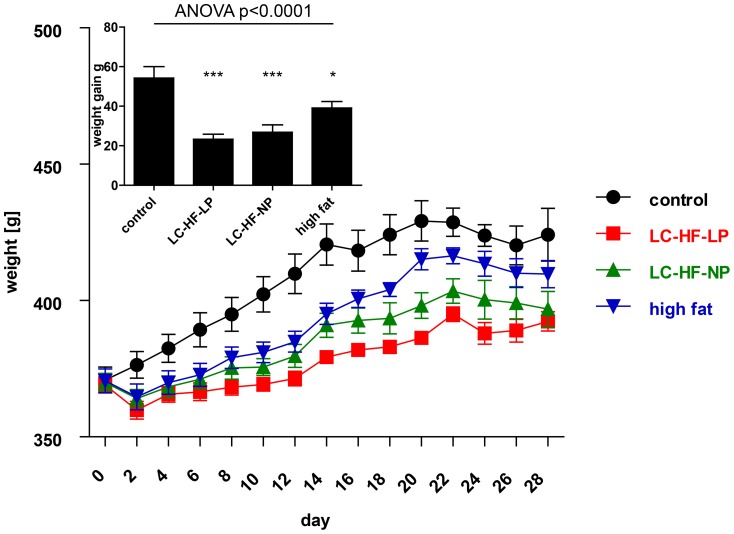
Figure 1. Weight curves of rats on the control diet (circles, fed ad libitum), compared to the three experimental diets (iso-energetic pair feeding): low-carbohydrate high-fat, low-protein diet (LC-HF-LP; squares), low-carbohydrate high-fat, normal-protein diet (LC-HF-NP; upward triangles) or high fat diet (downward triangles); p<0.0005, repeated measurements ANOVA.
The cumulative average weight gain for each group during the four week feeding period is given in the insert, analyzed by global one-way ANOVA and Dunnett tests for pairwise comparison vs. control: * p<0.05, *** p<0.001. Data are shown as means±SEM; n = 7 animals/group.

