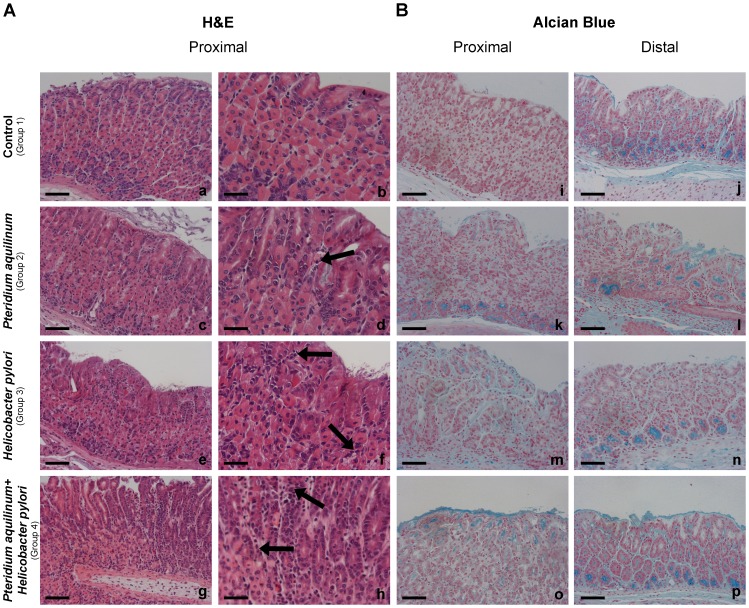
Figure 1. Histochemical characterization of mice gastric mucosa treated with Pteridium aquilinum and/or infected with Helicobacter pylori.
Histochemical staining with hematoxylin and eosin (Panel A) and Alcian Blue (pH = 2,5) with nuclear red staining (Panel B) of mice gastric mucosa of: Control (Group 1) (a,b,i,j), Pteridium aquilinum treated (Group 2) (c,d,k,l), Helicobacter pylori infected (Group 3) (e,f,m,n) and both Pteridium aquilinum treated and Helicobacter pylori infected (Group 4) (g,h,o,p). Since the results observed at 4 and 7 weeks time points were identical, only a representative picture is included for each experimental condition. Bar = 40 µm (a,c,e,g and i-p) and bar = 20 µm (b,d,f,h). Arrows indicate inflammatory cells.

