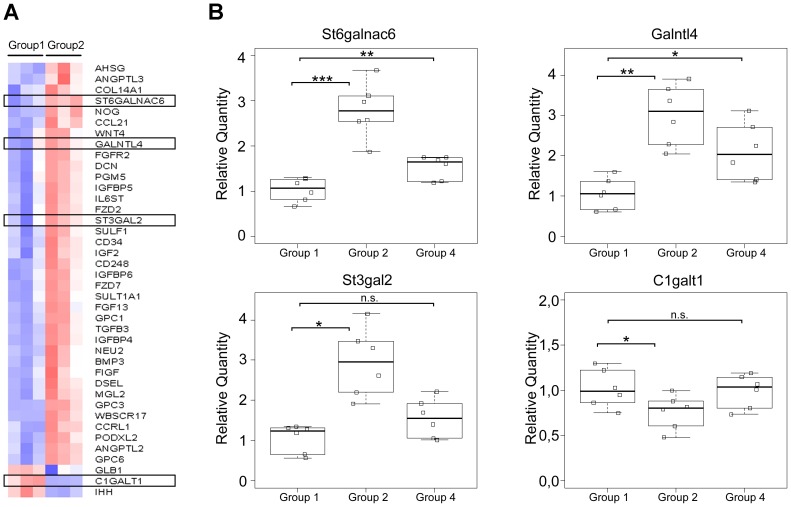
Figure 3. Glycosyltransferases expression analysis of gastric mucosa from Pteridium aquilinum exposed mice. Panel A –
Heatmap of the Glyco-gene Chip array analysis obtained when comparing group 1 (control mice) with group 2 (mice treated with Pteridium aquilinum). Red and blue indicate increased and decreased expression relative to the mean transcript expression value, respectively. The transcripts identified as differentially expressed were those with adjusted p-value <0.1 and fold change >1.3. Panel B – Real-time PCR analysis for expression of St6galnac6, Galntl4, St3gal2 and C1galt1 in gastric mucosa from control (Group 1), Pteridium aquilinum treated (Group 2) and concomitantly Pteridium aquilinum treated and Helicobacter pylori infected (Group 4) mice. The gene used as reference was Hprt1. Significance was evaluated using the Shapiro-Wilk test. n.s. not significant p<0.05(*); p<0.01(**); p<0.005 (***).

