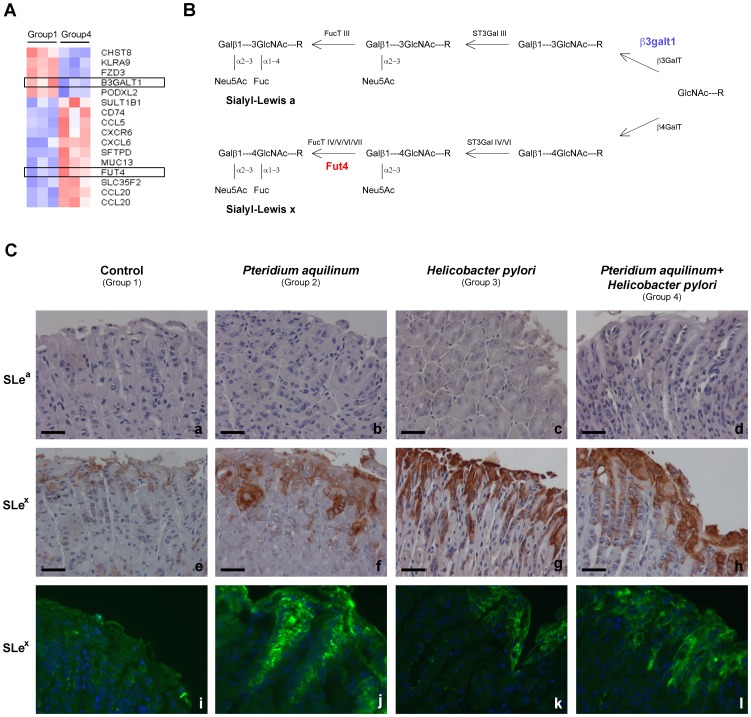
Figure 5. Glycosylation alterations in mice gastric mucosa upon Pteridium aquilinum treatment and concomitant Helicobacter pylori infection.
Panel A – Heatmap of the Glyco-gene Chip array analysis obtained when comparing group 1 (control) with group 4 (treated with Pteridium aquilinum and Helicobacter pylori infected). Red indicates increased and blue indicates decreased expression relative to the mean transcript expression value. The transcripts identified as differentially expressed were those with adjusted p-value <0.1 and fold change >1.3. Panel B – Schematic representation of the biosynthesis of sialylated terminal structures. The enzymes or family of enzymes responsible for each step of the biosynthesis are indicated. The enzymes identified as showing different expression levels in Pteridium aquilinum treated and Helicobacter pylori infected mice (Group 4) are highlighted in red (increased expression) and blue (decreased expression). Panel C – Immunohistochemistry for evaluation of expression of Sialyl-Lewis a (SLea) antigen (a–d) and for Sialyl-Lewis x (SLex) (e–h). Additional immunofluorescence evaluation performed for SLex (i–l). Bar = 20 µm.

