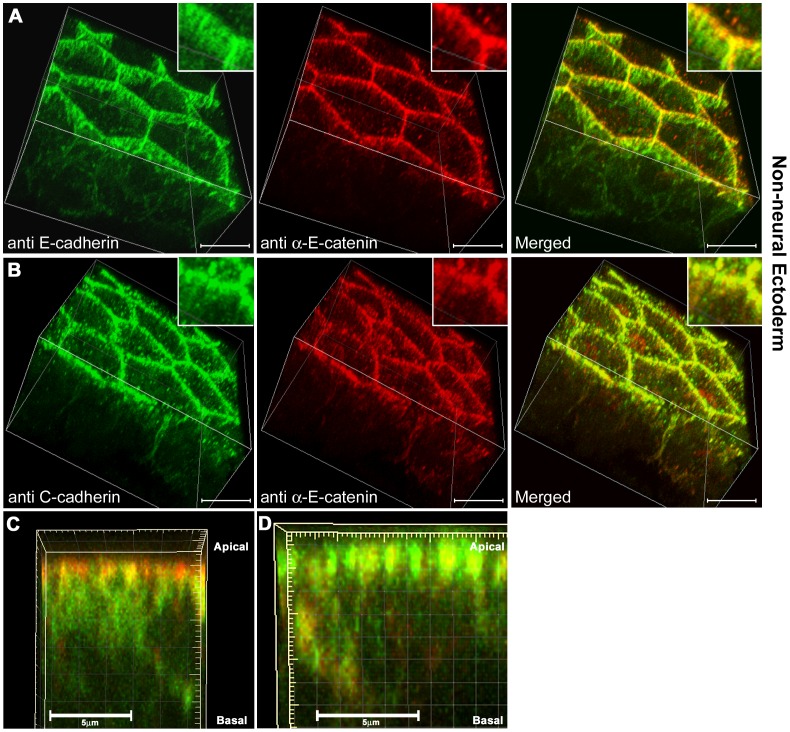
Figure 10. Three-dimensional projections of high resolution confocal images of cleared non-neural ectodermal cells.
(A) E-cadherin (green) and αEC (red) staining in wholemount, cleared, non-neural ectoderm samples imaged at 100× in nyquist limit and using a 2× zoom. (B) C-cadherin (green) and αEC (red) staining.(C) Side view projection of a 3D image stack from a single cell-cell contact membrane, E-cadherin (green) and αEC (red). (D) Side view projection of a 3D image stack from a single cell-cell contact membrane, C-cadherin (green) and αEC (red). Scale bars in A-B, 15 µM, C-D, 5 µM.

